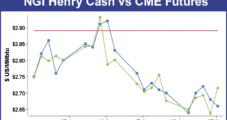
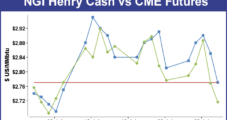
Natural gas trading for the week ending Aug. 28 was a sea of tranquility compared to the wild gyrations emanating from Wall Street andother commodity markets. In Monday’s trading alone the Dow Jones Industrial Average opened with a 1,000 point plunge and ended the day with a loss of 588 points, the worst since August 2011. Natural gas traders were more subdued.
Topic / NGI Weekly Gas Price Index
SubscribeNGI Weekly Gas Price Index
Articles from NGI Weekly Gas Price Index
Weekly Natgas Weakens, But Equity Markets Spiral Lower
There were a lot of long faces in both the energy and financial markets for the week ended Aug. 21. Natural gas physical and futures both sustained a double-digit drubbing and the NGI Weekly Spot Gas Average fell 14 cents to $2.54. That, however, paled in comparison to the 531-point swan dive the Dow Jones Industrial Average took on Friday.
August 21, 2015
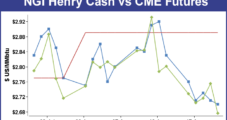
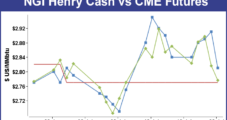
Weekly Natural Gas Prices Post Modest But Broad Gains
Physical natural gas prices for the week ending Aug. 14 were remarkably consistent with nearly all points gaining between a nickel and a dime. The NGI Weekly Spot Gas Average rose 10 cents to $2.68 and only a handful of points nationally traded in the red.
August 15, 2015
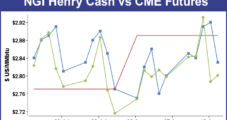
Weekly Natgas Prices Unswayed By Record Power Demand, Bullish Storage Build
If believers needed any more assurance of a well supplied market, they had only to look at Texas and the week’s blistering heat to gain an appreciation of just how ample current supplies are. Texas recorded back to back record power burns Thursday and physical and futures prices moved nary an inch.
August 7, 2015
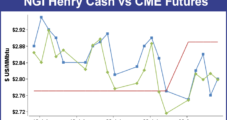
Northeast Surge Lifts Weekly Natural Gas Quotes
It was a tale of two markets for the four-day July physical natural gas trading week that ended on Thursday. Gains in the Northeast separated themselves from the rest of the market with an overall advance of 43 cents to average $2.27, thus lifting the NGI Weekly Spot Gas Average by a dime to $2.70. Outside of the Northeast it was a differentstory with prices mired in a narrow trading range less than a nickel either side of unchanged.
July 31, 2015
NatGas Held To Narrow Moves In Weekly Trading; Futures Slide A Dime
Talk about a balanced market! In weekly trading all but a handful of points moved less than a nickel either side of unchanged. TheNGI Weekly Spot Gas Average eased a miserly 2 cents to $2.60, and even those actively traded points showing the greatest gains and losses had a hard time making meaningful double-digit moves.
July 24, 2015
Forecast Heat Prods Weekly Natural Gas Prices Higher; Futures Bulls Stirring
The first forecast jolt of major heat and humidity across major population centers was able to lift weekly prices across almost all delivery points. For the week ended July 17, the NGI Weekly Spot Gas Average gained a solid 18 cents to $2.62, and only three market points, all in New York, fell into the red.
July 17, 2015
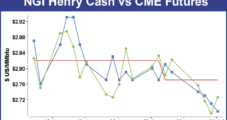
Weekly California NatGas Weakens, East Strengthens As Gas Migration West Builds
On the surface it looked like a benign week of trading as overall prices moved little and many areas of the country experienced only modest price changes. The NGI National Weekly Spot Gas Average fell just a penny to $2.44, but larger moves in the East and California may augur a shifting natural gas price landscape.
July 10, 2015
Record-Breaking Eastern Weekly Natural Gas Prices Lead Market Lower
Outside of the East Coast there weren’t many fireworks across the market landscape, and generally the three-day trading week saw prices move less than a dime. In the East, however, it could have been a replay of the attack on Ft. McHenry in Baltimore which in 1814 gave rise to the “Star-Spangled Banner.”
July 2, 2015
Listen to the latest episode of our newest podcast NGI's Hub and Flow via: