As the nation inaugurated its 45th President Friday, a new era of risk and uncertainty enveloped the electorate, with highly contentious if not polarized factions on either side of the major issues facing the new Trump presidency. The natural gas market faces its own set of challenges and uncertainties, with both bulls and bears armed with persuasive arguments.
Topic / NGI Weekly Gas Price Index
SubscribeNGI Weekly Gas Price Index
Articles from NGI Weekly Gas Price Index
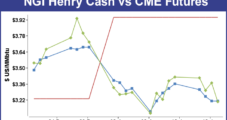
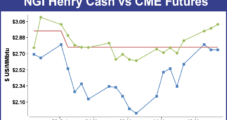
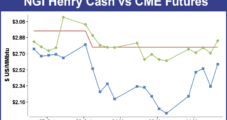
Weekly NatGas Tumbles, But Firming Futures Augur Well For Coming Week
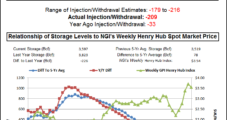
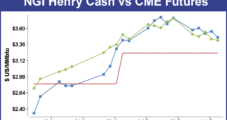
The weekly change in spot futures has a way of correctly forecasting the direction in the NGI Weekly Spot Gas Average for the following week, and this week was no exception. Last week, the February contract fell a stout 43.9 cents and for the week ended January 13 the NGI Weekly Spot Gas Average gave up 33 cents to $3.22.
January 13, 2017
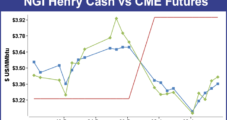
Weekly January NatGas Trading Sacked For An Early Loss
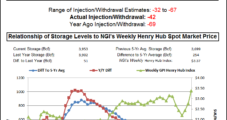
Stock market devotees often refer to the “January effect” where if the market can advance during January, it is likely to post gains for the entire year. There are still several weeks left in January, but if there is a “January effect” for natural gas prices, it will have to pull prices out of an initial hole. The NGI Weekly Spot Gas Average fell 8 cents to $3.55 on warmer than normal temperatures in a number of areas around the country, and gains in the Northeast and Southeast were able to partially offset broader losses of 20 cents or more at most market points.
January 6, 2017
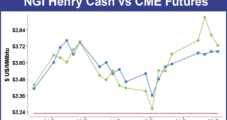
Northeast Weekly Losses Fail To Dampen Bullish Spirits
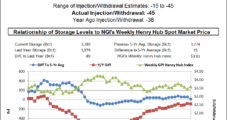
For the holiday-shortened trading week physical natural gas managed to keep on trucking higher as nearly all sections of the country recorded about a dime gain. The only region of the nation not in the plus column was the Northeast, and at the end of the three-day trading week the NGI National Weekly Spot Gas Average had added 11 cents to $3.63.
December 30, 2016
Weekly Natgas Cash Slides But Futures Gain Ahead Of Holiday Weekend
Natural gas sellers got their Christmas presents early when weekly prices reached $3.92 for the week ending Dec. 16, but a week later the grinch emerged to take some of those gains back. The NGI Weekly National Spot Gas Averaged fell 40 cents to $3.52, and only a handful of points traded unchanged or in the black.
December 23, 2016
Northeast Weekly Gains Trump Broader Losses, But NatGas Futures Swoon
Weekly natural gas prices for the week ended Dec. 17 followed the cue of futures from the previous week and closed higher, but the market was sharply divided, with triple digit gains in the Northeast offsetting broader declines in Midwest Market Zones and Producing Zones.
December 16, 2016
Weekly Natgas Cash Posts 4th Double-Digit Weekly Gain; More Seen Coming
Oh what a week it was, but the half-dollar weekly natural gas cash gains shouldn’t have come as much of a surprise to those who noted that January futures bounded higher by a stout 40 cents during the previous week. With chilly winter temps now on hand for much of the country, further strengthening is likely in the forecast.
December 9, 2016
It Ain’t Over Till It’s Over; Weekly NatGas Soars
Just when the natural gas cash gains for the short week ended Nov. 23 looked like they were going to be hard to beat, the market moves for the week ended Dec. 2 proved even greater.
December 2, 2016
Natural Gas Bulls Get Early Stuffing As Weekly Quotes Soar
It may have been a short three-day trading week, but you would never have known it from the size of the weekly gains. All but one point followed by NGI romped higher by double-digits, and the NGI Weekly Spot Gas Average jumped 41 cents to $2.70.
November 23, 2016
Winter-Like Chill Sends Weekly NatGas Quotes Hopping
Weekly traders were able to shrug off another backbreaking rise in natural gas storage and instead concentrated on the arrival of the first shot of a winter-like chill for the week ended Nov. 18. That was enough to send both futures and cash higher by double-digits and the NGI Weekly Spot Gas Average vaulted 24 cents to $2.29.
November 18, 2016
Listen to the latest episode of our newest podcast NGI's Hub and Flow via: