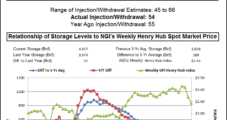
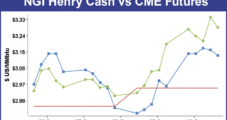
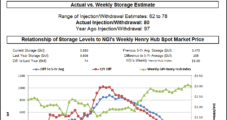
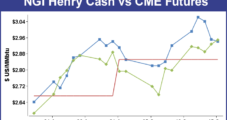
The weekly natural gas cash average failed to break under $2 for the week ended Nov. 11, but the stress of moderate weather and record storage inventories prompted double-digit losses throughout the country with the notable exception of Appalachia and the Northeast, which were propped up by a potential bout of cold.
Topic / NGI Weekly Gas Price Index
SubscribeNGI Weekly Gas Price Index
Articles from NGI Weekly Gas Price Index
Weekly NatGas Cash, Futures Race Each Other Lower
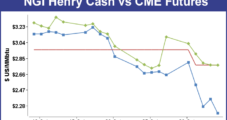
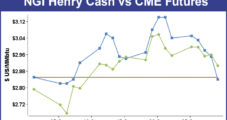
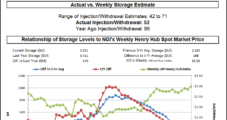
For the week ended Nov. 4 both weekly natural gas cash prices and futures fell hard and fell often. The decline of 25.6 cents in futures for the week ended Oct. 28, as it turns out, augured not only declines in cash prices, but futures as well.
November 4, 2016
Weekly Spot NatGas Follows Prior Week Futures Lower, Again
Once again the prior week’s change in natural gas futures correctly identified the week’s change in weekly spot prices. For the week ended Oct. 21 November futures plunged 29.2 cents, and for the week ending Oct. 28 the NGI Weekly Spot Gas Average fell 23 cents to $2.48.
October 29, 2016
Weekly NatGas Cash Holds On To Slim Gains, Yet Futures Tumble
Weekly natural gas trading for the week ending Oct. 21 was highly variable, and in a broad sense the weekly advance in the November contract for the week ended Oct. 14 of 9.2 cents did carryover into cash trading as the NGI National Spot Gas Average did rise 4 cents to $2.71. Traders in Texas, South Louisiana, and the Southeast might be inclined to disagree over the predictive power of the futures market as their regions lost ground.
October 21, 2016
Weekly NatGas Gains Follow Prior Week Futures Advance
True to form, the near 30-cent advance in the November futures for the week ended Oct. 7 augured higher weekly cash prices the following week. For the week ended Oct. 14, the NGI National Weekly Spot Gas Index gained a healthy 16 cents to $2.67, but in an environment of “what have you done for me lately,” traders will be watching to see if the futures advance of 9.2 cents for the week ended Oct. 14 will lift weekly cash quotes again.
October 14, 2016
Weekly NatGas Cash Flounders, But Futures Launch Well Above $3
Natural gas futures may be serving its function as a leading indicator for the cash market as a wide divergence took place in cash and futures trading for the week ending Oct. 7. The NGI Weekly Spot Gas Average fell 7 cents to $2.51, but the November contract added nearly 30 cents as the market digested a favorable Natural Gas Supply Association winter report and failed to yield to an overly large inventory report on Thursday. Hurricane Matthew sliced up the Florida coast with an estimated 0.5 Bcf/d loss in gas demand for the state.
October 7, 2016
Weekly NatGas Gains Come To An End With Northeast Leading The Way Lower
A string of weekly advances came to a screeching halt with the four-day trading week ended September 29. Only two of the points followed by NGI reached the positive side of the trading ledger and the NGI Weekly Spot Gas Average skidded 14 cents to $2.58. Most points outside Appalachia and the East were down about a dime, but outsized double-digit declines ruled most of New England, the Mid-Atlantic, and the Southeast.
September 30, 2016
Trading Places: Weekly NatGas Cash Up Nearly A Dime, But Futures Languish
The week’s natural gas trading was something of a role reversal from the week before with the physical market adding close to a dime, but spot futures eking out an advance of less than a penny. Last week natgas cash added a modest 2 cents to $2.63, but the futures raced higher by 15.1 cents to $2.948. For the week ending Sept. 23 the NGI Weekly Spot Gas Average rose 9 cents to $2.72, and October futures added a mere seven-tenths of a cent to $2.955 after briefly trading over $3.
September 23, 2016
Modest Weekly Natural Gas Gains Continue, But Futures Leap Higher
Weekly natural gas prices for the week ended Sept. 17 resembled something of a “tortoise and the hare” comparison, with the hare-like futures putting up double-digit gains and the physical market just plodding along.
September 16, 2016
Weekly NatGas Continues ‘On The Road To Recovery’
Weekly natural gas trading for the week ending Sept. 9 continued the trend of the prior two weeks with modest, single-digit gains. The NGI Weekly Spot Gas Average rose 6 cents to $2.61, and the week’s market points with the greatest gains and losses belonged to our neighbors to the North. Gas at Westcoast Station No. 2 soared $C1.31 to $C1.86/Gj and gas at Empress shed $C0.41 to $C2.53/Gj.
September 9, 2016
Listen to the latest episode of our newest podcast NGI's Hub and Flow via: