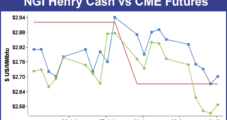
For the short trading week of Aug. 31 to Sept. 2, natural gas prices traded high and low with regional double-digit gains and double-digit losses spread across the trading landscape. After the smoke had cleared, though, the NGI Weekly National Spot Gas Average couldn’t even match the previous week’s modest 4-cent gain to $2.55, as the Weekly Average was unchanged.
Topic / NGI Weekly Gas Price Index
SubscribeNGI Weekly Gas Price Index
Articles from NGI Weekly Gas Price Index
California, Northeast Partially Erode Broader Weekly Gains
For the week ended Aug. 26 there was only nominal movement in weekly gas prices, but the roles were reversed from the previous week. Solid gains of a dime or more were posted at interior basins and Midwest market points, but declines in the Northeast and California pulled the averages down.
August 26, 2016
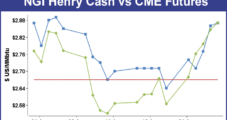
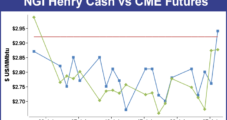
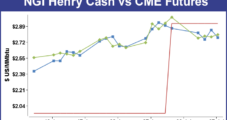
Weekly NatGas Cash, Futures Take Last Summer Vacation As Markets Show Small Moves
Apart from some weather and power-price driven gains on the East and West Coasts, weekly natural gas prices moved little for the week ended August 19 with producing basins and Midwest market centers moving within a few pennies of unchanged.
August 19, 2016
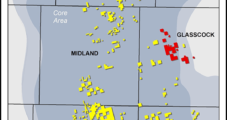
Parsley Grabbing More West Texas Leasehold in $400M Deal
West Texas-focused Parsley Energy Inc. continued its Permian Basin spending spree on Monday, agreeing to pay $400 million for a bolt-on leasehold in the Midland sub-basin.
August 16, 2016
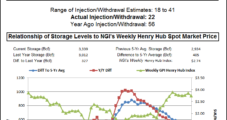
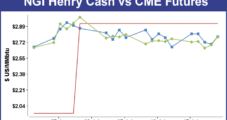
Strong Northeast Can’t Offset Broader Weekly NatGas Losses
Not even a heavy-handed intervention by Mother Nature could keep weekly natural gas prices from sliding into the loss column. Hot, humid weather in New York, Philadelphia, and the East Coast sent heat indices deep into triple digits, but at the end of the week theNGI Weekly Spot Gas Average was 6 cents lower at $2.53.
August 12, 2016
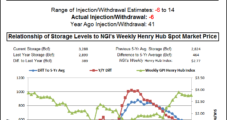
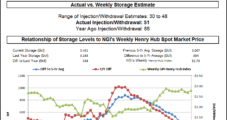
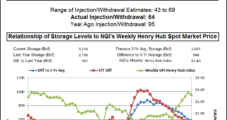
Weekly NatGas Unchanged As Traders Grapple With Unusual Summer Storage ‘Fill’
Weekly natural gas prices drew to a tie for the week ending August 5 as stout gains in the traditional producing basins of Texas, Louisiana, Rockies, and Midcontinent were offset by just as stout declines in the Northeast, Southeast, Appalachia and California. At the end of the week theNGI National Weekly Spot Gas Average was unchanged at $2.59.
August 5, 2016
Southeast, Northeast Lead The Pack Higher In Weekly Natural Gas Trading
Last week attention was focused on California and the fractious weekly trading that had that state posting a stout 17-cent weekly gain to $2.91, but this week’s short four-day trading week highlighted price moves in the Southeast and Northeast.
July 29, 2016
California Out In Front Of Weekly Natural Gas Trading
If you weren’t looking at California, you might think that weekly natural gas trading for the week ended July 22 was in the summer doldrums. Most points moved within a nickel of unchanged, and theNGI Weekly National Spot Gas Average sported a change of all of a 3-cent advance to $2.57.
July 22, 2016
Weekly NatGas Prices Drop A Penny In Tranquil Trading; Futures Slide
On balance weekly natgas trading was a subdued affair, but you would be hard pressed to convince traders working the Rockies, California, or Southeast markets as the Rockies and California experienced double-digit gains and the Southeast endured average losses of nearly 30 cents.
July 15, 2016
Northeast, Southeast Gains Highlight Weekly Physical NatGas Trading; Futures Slump
Wide regional variations characterized weekly spot natural gas trading for the shortened week ended July 8. Towering double-digit gains in the Northeast and Southeast, however, were unable to counter losses extending from Appalachia to California and the Rocky Mountains to the Gulf Coast.
July 8, 2016
Listen to the latest episode of our newest podcast NGI's Hub and Flow via: