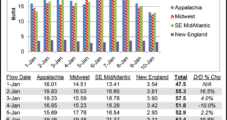
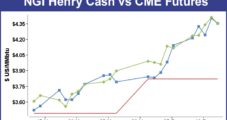
The polar vortex that ripped through the Midwest and East causing hardship and much discomfort had an impact on the natural gas market similar to an entry-level earthquake. Lots of shaking and movement, but overall in the end everything was left standing about in the same place. For the week ended Jan. 10 the NGI Weekly Average Spot Gas Price eased all of a penny to $5.40. Variation about that average was high with the Northeast posting a trade range of $2 to $99 before averaging $9.43, up $1.09. The Midwest and Midcontinent posted losses of 55 cents and 42 cents, respectively, to average $5.21 and $4.76.
Topic / NGI Weekly Gas Price Index
SubscribeNGI Weekly Gas Price Index
Articles from NGI Weekly Gas Price Index
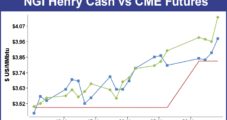
Bone-Rattling Cold, Winter Storm Hercules Catapult Eastern Cash Prices Higher
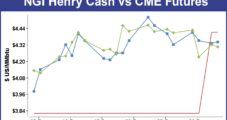
Winter storm Hercules, which produced record cold in areas of the United States and dropped more than a foot of snow in the Northeast, dominated the attention of gas traders for the holiday-shortened Dec. 31-Jan. 3 trading week. While a number of regions surveyed saw small declines in average prices for the week, stout gains in the East pushed NGI’s Weekly Spot Gas Average up 94 cents to $5.41/MMBtu with a wide range of individual trades from $1.50 at Tranco-Leidy Line to $39.00 at Transco Zone 6-NY.
January 5, 2014
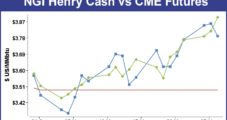
Weekly Gains Send Chicago Citygate To 2 1/2 Year High
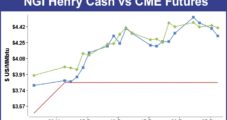
At first glance weekly gas prices were kind to neither the bulls nor the bears. For the week ended Dec. 27 the NGI National Weekly Spot Gas Average fell by just a penny to $4.47, but major swings were recorded throughout the country. Chicago Citygate bulls enjoyed the highest NGI weekly price in 2 1/2 years at $4.81. Of the actively traded points the Northeast was home to market points showing the greatest gains as wellas losses. In New England Iroquois Zone 1 recorded the largest advance rising 81 cents to $5.77, and at the other end of the spectrum deliveries to Algonquin Citygates tumbled $4.41 to $9.75.
December 27, 2013
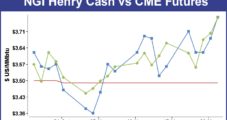
Weekly Prices Off, But Futures Jump On Record 285 Bcf Storage Draw
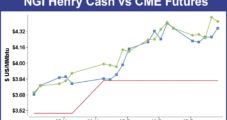
Weekly physical gas prices for the five trading days ending Dec. 20 were awash in a sea of red ink. NGI’s National Weekly Spot Gas Average came in at $4.48, down a stout 66 cents with all regions losing anywhere from a nickel to more than $2.
December 20, 2013
Northeast Posts Largest Weekly Gains On Broad Winter Storm
The NGI Weekly Spot Gas average for the week ended Dec. 13 bounded higher by $1.03 to average $5.14 led in large part by the Northeast regional gain of $3.18 to average $7.02 as a broad Arctic chill brought the region’s first real dose of winter.
December 13, 2013
Arctic Rush Pushes Rockies, California to Largest Weekly Gains
For the week ended Dec. 6 the NGI Weekly Spot Gas Average nationally rose 18 cents to $4.11. The strongest gains were posted in the Rocky Mountains and California with the Rockies adding a stout 75 cents to $4.58 and California quotes gaining 42 cents to $4.38.
December 8, 2013
Plump Gains Characterize Short Trading Week
The NGI weekly spot gas average posted a stellar overall 24 cent gain to $3.93 for trading Nov. 25 and Nov. 26. All locations posted double-digit gains with the exception of three points on Iroquois Pipeline, which each shed less than a dime. Regionally the Northeast was a land of extremes tallying the week’s biggest winners and losers. Of the actively traded points Algonquin Citygates made it to the top adding 88 cents to $7.84 and deliveries to Iroquois Zone 2 eased 9 cents to $4.58. Regionally the Northeast outdistanced all section of the country with a 34 cent rise. California trailed the pack with “only” an 18 cent gain.
December 1, 2013
Surging Algonquin Leads Weekly Quotes Higher
Bulls were clearly in the driver’s seat for the week ending Nov. 22. The NGI National Spot Gas Average rose 11 cents to $3.69, and all actively traded points scored gains. Leading the pack higher was the trading at the Algonquin Citygates Friday for weekend and Monday delivery with a whopping $9.51 rise to $14.01. For the week, prices at the Algonquin Citygates rose a hefty $1.07 to $6.96. Other Northeast points weren’t far behind.Tennessee Zone 6 200 L added 80 cents to $6.57 and Iroquois Zone 2 was up 49 cents to $4.67. Deliveries to Transco Zone 6 New York added 44 cents to $4.08.
November 24, 2013
Week’s Cash and Futures Trading Winds Down With Gains All Around
For the week ending Nov. 15 the NGI National Spot Gas Average posted a healthy 13 cent gain to average $3.58 with only one Rockies point and a handful of Northeast locations failing to make it to the positive side of the trading ledger. Of all the market points the Northeast was home to the week’s biggest winner and also the biggest loser.
November 15, 2013
Weekly Prices Peg Northeast As Lowest Cost Producer
It was a rough week for the bulls as NGI’s National Spot Gas Average fell a hefty 17 cents from the previous week to $3.45. All regions of the country were down by double digits and only a handful of individual points in the Northeast managed to make it to the positive side of the trading ledger.
November 8, 2013
Listen to the latest episode of our newest podcast NGI's Hub and Flow via: