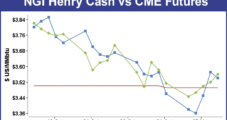
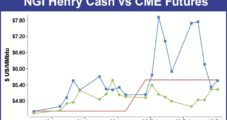
Gone is the high volatility of winter trading, and for the moment traders can luxuriate in typical shoulder-season price moves characterized by changes of a few cents compared to the frequent multi-dollar moves of winter. For the week ended April 4 the NGI National Weekly Spot Gas Average fell 27 cents to $4.49, and most regions experienced weekly moves of a nickel or more to over 50 cents, with the Midwest showing the greatest volatility, dropping 89 cents to $4.84. Prices in the Northeast tumbled 57 cents to $4.30, and the Northeast was home to the greatest gainer, the Millennium East Pool, up 46 cents to $3.99 and the largest decline at Tennessee Zone 6 200 L, down $4.20 to $5.38.
Topic / NGI Weekly Gas Price Index
SubscribeNGI Weekly Gas Price Index
Articles from NGI Weekly Gas Price Index
Spring Who? NatGas Futures, Physical Record Weekly Gains on Lingering Cold
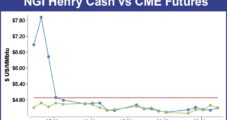
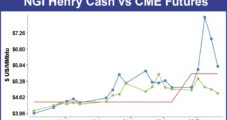
Even though spring has officially begun, chilly temps for much of the country led physical natural gas prices to move higher for the five trading days ending March 28. NGI's National spot gas average increased by 16 cents to average $4.76, with individual point bumps ranging from a couple of pennies at Gulf Coast locations to more than a dollar at a few Northeast sites.
March 28, 2014

Traders See Futures Buying Opportunity Despite Weekly Losses
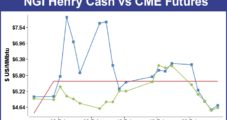
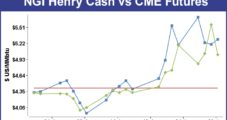
Weekly gas prices ending March 21 had the look and feel of air escaping from a flat tire as the first signs of spring became evident following what for many regions was a brutally cold winter. Nearly all physical cash points were down by double digits with the exception of a few Rockies and California locations which managed gains of just a few pennies. Every region followed by NGI posted a loss and the NGI National Spot Gas Average fell 43 cents from the previous week to $4.60. The individual market point with the greatest gain was El Paso S Mainline with a rise of all of 9 cents to average $4.65, and the greatest decline was seen at lightly traded Dracut with a loss of $8.86 to $7.75.
March 21, 2014

Weekly Prices Post Record Decline; Nearly All Points Take Hard Fall
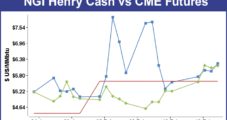
Weekly national spot gas prices suffered the worst drubbing since NGI began keeping score in Sept. 1999 as traders began to eye the finish line of what will go down in the history books as one of the most frigid winters in memory. The NGI National Weekly Spot Gas Average plunged a gut wrenching $3.15 to average $5.03 for the week ended March 14. The previous record was the decline of $1.90 to $7.53 seen Feb. 14, 2014.
March 14, 2014

Hefty Gains And Double Digit Losses Punctuate Weekly Trading
It was another wild and wacky week of spot gas trading across the country. There were wide variations in both price changes and absolute price levels and the Midwest and Midcontinent were the Kings Of The Hill.
March 7, 2014
Weekly Traders Hit Hard With Futures, Physical Price Volatility
It was a week of gut-wrenching price changes for both futures and physical natural gas traders. The March futures contract expired Wednesday at a “reasonable” $4.855, but just two days prior, it had traded as high as $6.493 before falling into a tailspin and losing 69.0 cents on the day and finishing at $5.445 Monday. Tuesday’s and Wednesday’s trading added cumulative losses of another 59.0 cents — a 21% drop over three days — and any March futures bulls left standing limped off into the cold and snow to shore up margin accounts.
February 28, 2014
Cash Sees Volatile Weekly Performance; Futures Spike 18%
Wide variations in natural gas pricing marked the week ended Feb. 21 as multi-dollar gains in the Midwest and Midcontinent along with a five-year high reached by the March futures offset large dollar losses in the East and smaller declines nearly everywhere else.
February 21, 2014
Weekly Prices See Wide Variations Following Winter Storm Pax
A paralyzing concoction of snow, ice, sleet, and abnormally low temperatures for much of the East prompted a wide range of changes to the natural gas pricing matrix. A series of storms began the week in North Louisiana and by Friday residents of Philadelphia were shoveling more than a foot of snow. NGI’s weekly spot gas average nationally fell $1.90 to $7.53 for the week ended Feb. 14, but the regional swings were wide, almost as wide as the variations posted by individual points.
February 14, 2014
Weekly NatGas Prices Travel Every Which Way But Loose
It was a wild and wooly week of gas trading where multiple dollar gains and losses were commonplace throughout the country as frigid temperatures in some regions were offset by more temperate conditions in others. Pipelines strained under the high demand. No matter the weekly gain or loss, prices were regionally and nationally high across the country for the week ending Feb. 7, with the NGI National Weekly Spot Gas Average vaulting $1.67 to a stout $9.43.
February 7, 2014
Northeast Gas Price Drops Overshadow Nation’s Gains; Futures Volatility Returns
For the four-day trading week to end the month of January, physical natural gas prices were higher nearly across the board, except for in the Northeast, where prices were in steady retreat following record prices on polar vortex cold the previous week.
January 31, 2014
Listen to the latest episode of our newest podcast NGI's Hub and Flow via: