Weekly spot gas prices reversed the prior week’s 2-cent setback and for the week ended August 18 theNGIWeekly National Spot Gas Index posted a healthy 11-cent advance to $2.71.
Topic / NGI Weekly Gas Price Index
SubscribeNGI Weekly Gas Price Index
Articles from NGI Weekly Gas Price Index
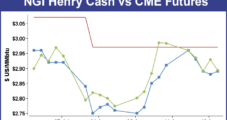
Physical NatGas Trading A Mixed Bag While September Futures Jump 20 Cents
Physical natural gas trading for the week ended Aug. 11 was a tale of two stories, as Northeastern, Appalachian and Californian price points were predominantly in the red on moderating temperatures and pipe constraints, while the rest of the country’s locations inched higher from a couple of pennies to nearly a dime.
August 11, 2017
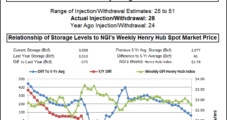
NatGas Price Bulls Take A Modest Hit In Weekly Trading
There was both good news and bad news for the bulls in weekly physical natural gas trading during the week ended August 4. The bad news was that the market still continued to deteriorate with theNGI Weekly National Spot Gas Average losing 4 cents to $2.62, but the good news is that it fell far less than the previous week’s pounding, which took the market down 22 cents to $2.66.
August 4, 2017
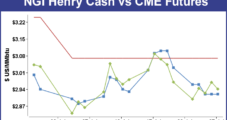
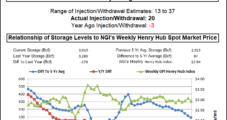
Weekly NatGas Trading Accompanied By Broad Losses
Of all the points followed byNGI,only six traded in positive territory for the week ended July 28. The market failed to build on the 14-cent rally from the week before, and theNGI Weekly National Spot Gas Average dropped 22 cents to $2.66.
July 28, 2017
Mostly Runs, Hits, And No Errors In Weekly NatGas Trading
Nearly all U.S. points gained ground for the week ended July 21 and most points posted gains well into double digits. Gains at Northeast points were most impressive, with some points adding close to a $1.
July 21, 2017

Weekly NatGas Grinds Higher On Seasonal Warmth
Weekly spot natural gas trading reverted to a more traditional warmth-driven format for the week ending July 14. Prices rose at most market points with only a few western and California prices falling into the loss column, and theNGIWeekly Spot Gas Average added 9 cents to $2.74.
July 14, 2017

July Typically Warmest Month, But Weekly NatGas Prices Decline
For the holiday-abbreviated Wednesday-Friday natural gas trading week weather factors kept traders on their toes as searing heat in California lifted prices, but broader declines throughout the rest of the nation dampened market hopes that weather-driven gains would be in full swing by now.
July 7, 2017
Weekly NatGas Inches Higher Ahead Of Long Weekend
For the shortened week of trading ended Thursday quotes were something of a mixed bag with little overall change, but significant differences arose between producing zones and market zones in the Northeast and California.
June 30, 2017
East, West Coast Gains Almost Offset Producing Region Losses In Weekly NatGas Trading
Natural gas bulls were roaming East Coast and West Coast market zones in weekly trading, but Midwest market zones and most producing regions were squarely in the hands of the bears.
June 24, 2017
Weekly Quotes Remain Flat In Ho-Hum Trading
Weekly natural gas trading elected to mark time for the week ended June 16 as few points traded much beyond a penny or two from levels posted the week earlier. TheNGIWeekly Spot Gas Average was unchanged at $2.70.
June 16, 2017
Listen to the latest episode of our newest podcast NGI's Hub and Flow via: