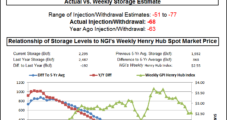
Yet another March nor’easter delivered a late-winter boost to spot prices throughout the Northeast and Mid-Atlantic for the week ended Friday, though results were mixed across other regions. The NGI Weekly Spot Gas Average added 12 cents to $2.68/MMBtu.
Topic / NGI Weekly Gas Price Index
SubscribeNGI Weekly Gas Price Index
Articles from NGI Weekly Gas Price Index
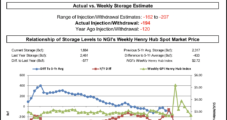
‘Last Hurrah’ For Winter? East Coast Storms Help Lift Weekly NatGas Spot Prices
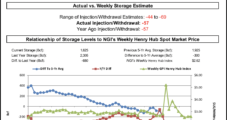
Shoulder season may be just around the corner, but a couple winter storms crashing into the populated East Coast during the week proved enough to lift weekly natural gas spot prices. The NGI Weekly Spot Gas Average gained 13 cents to $2.56/MMBtu.
March 9, 2018
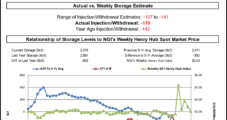
Spot Prices Weaken in West as Natural Gas Markets Close Book on Mild February
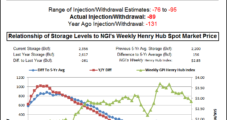
Shoulder season-like weather across much of the country to close out February contributed to a mix of changes in the natural gas spot market for the week ended Friday. But generally prices trended downward amid moderate national demand; the NGI Weekly Spot Gas Average fell 21 cents to $2.43/MMBtu.
March 2, 2018
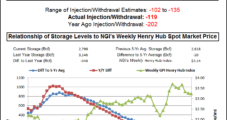
Cold West, Warm East Shapes Weekly Natural Gas Spot Prices; Futures Bottoming
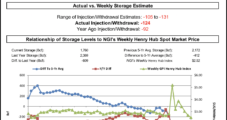
It was a tale of West versus East in the natural gas spot market for the week ended Friday. Weather maps seemed to split the Lower 48 down the middle, with colder than normal temperatures driving up prices across the Rockies and California as East Coast cities experienced unseasonable February warmth.
February 23, 2018
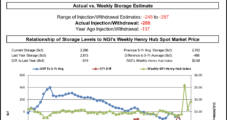
NatGas Futures Consolidating Amid Bearish Weather Outlook; SoCal Leads Weekly Spot Gains
Natural gas futures slid yet again during the week ended Friday as a lack of any impressive heating demand had the market looking past winter into the shoulder season. This set the tone for a cash market that showed signs of shedding its winter skin; the NGI Weekly Spot Gas Average dropped 29 cents to $2.46.
February 16, 2018
Natural Gas Futures Sell-Off Continues for Second Straight Week; Spot Prices Sink Too
A precipitous slide in the natural gas futures market that began when the calendar rolled over to February continued for the week ending Friday, setting a bearish tone for spot prices across most regions. The NGI Weekly Spot Gas Average skidded 50 cents to $2.75/MMBtu.
February 9, 2018
Up-and-Down Week for NatGas Markets Sees Spot Prices, Futures Slide
Demand swings and a moderating outlook on the relative intensity of forecast February arctic cold made for an up-and-down week in the natural gas markets. A few East Coast points posted weather-driven gains for the week as a sell-off in futures pulled the rug out from large portions of the cash market; NGI’s Weekly Spot Gas Average fell 17 cents to $3.25/MMBtu.
February 2, 2018
Bullish Week for NatGas Futures Amid Tight Storage, Frigid Forecast; Spot Prices Weaken
Natural gas futures surged during the week ending Jan. 26 thanks to lean storage inventories and weather guidance showing the potential for a return of frigid temperatures in February. Cash prices weakened as temperatures moderated from the week before, and the NGI Weekly Spot Gas Average fell 64 cents to $3.42/MMBtu.
January 26, 2018
Winter Hits Deep South to Drive Up Weekly NatGas Spot Prices; Futures Mull Lean Storage
A blast of cold temperatures and a rare winter storm in Texas helped lift natural gas spot prices for the week ending Jan. 19, while a lean storage picture helped futures reach an eight-month high. The NGI Weekly Spot Gas Average climbed 45 cents to $4.06/MMBtu.
January 19, 2018
Thawing Temps Drop Weekly Natural Gas Spot Prices as Record Storage Pull Rallies Futures
A thaw from early January’s bone-chilling temperatures had natural gas spot prices retreating across the board for the week. Another round of winter weather forecast to arrive over the long Martin Luther King Jr. holiday weekend couldn’t offset early-week East Coast moderation from record highs, and the NGI Weekly Spot Gas Average dropped $7.10 to average $3.61/MMBtu.
January 12, 2018
Listen to the latest episode of our newest podcast NGI's Hub and Flow via: