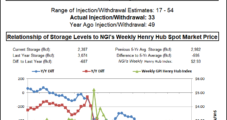
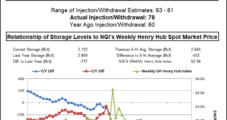
Weekly physical natural gas prices settled in the black at most pricing locations for the Aug. 13-17 period as hot weather settled over much of the country. High temperatures up and down the Eastern Seaboard soared into the 90s, while Texas and California remained under scorching conditions.
Topic / NGI Weekly Gas Price Index
SubscribeNGI Weekly Gas Price Index
Articles from NGI Weekly Gas Price Index

Weekly Prices Surge on Heat; Eastern U.S. Packs Hefty Gains
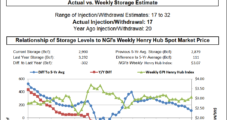
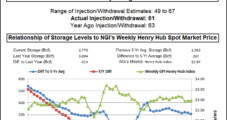
Weekly prices skyrocketed as a heat wave blanketed much of the East Coast throughout the week, lifting daytime temperatures into the low 90s and making for some of the strongest demand of the summer so far.
August 10, 2018
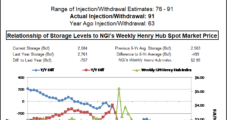
Weekly NatGas Prices Mixed After Deep Losses at SoCal, Heat-Induced Gains Elsewhere
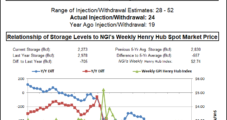
Weekly prices were mixed after weather forecasts trended hotter for the coming days after heavy rains doused demand in key markets earlier in the week. Solid gains in the futures market also lent support to cash prices late in the week, lifting weekly prices at the majority of points. Still, a dramatic plunge off record highs in southern California sent NGI’s Weekly National Spot Gas Average down 6 cents to $2.87/MMBtu.
August 3, 2018
Record-Setting Week for SoCal as August Natural Gas Futures End on High Note
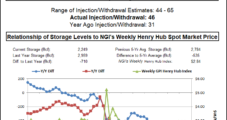
Big heat-driven spikes in California and the Desert Southwest stood out in an otherwise quiet week for natural gas spot prices; a record-setting day for the volatile SoCal Citygate helped send NGI’s Weekly National Spot Gas Average 21 cents higher to $2.93/MMBtu.
July 27, 2018
SoCal Swings Higher on Heat as Weekly Natural Gas Spot Market Mixed
Price blowouts in Southern California headlined natural gas spot trading for the week ended Friday, while more comfortable temperatures helped send prices lower throughout the Midwest and East; theNGIWeekly National Spot Gas Average added 2 cents to $2.72.
July 20, 2018
Weekly Natural Gas Spot Prices Even Amid Rising SoCal, Falling New England
The natural gas spot market for the week ended Friday featured rising prices in toasty Southern California and discounts along the opposite coast thanks to some more moderate temperatures in the East; the NGI Weekly National Spot Gas Average finished unchanged at $2.70/MMBtu.
July 13, 2018
Spiking SoCal Leads Weekly Natural Gas Spot Prices Higher; Futures Slide
A heat wave in Southern California helped drive natural gas spot prices higher on average for the week ended Friday, even as points throughout the Gulf Coast slid along with declines in futures; theNGIWeekly National Spot Gas Average added 8 cents to $2.70/MMBtu.
July 6, 2018
Weekly Natural Gas Spot Prices Mixed as Heat Lifts East Coast; Production Weighs on Futures
Hot temperatures helped boost natural gas spot prices across the Mid-Atlantic and Northeast for the last week of June, though declines in Texas and the West left the NGI Weekly National Spot Gas Average a penny lower at $2.62/MMBtu.
June 29, 2018
Weekly Prices Mostly Rise, But Returning Production Sends Rockies Prices Lower
Weekly natural gas prices were on the upswing this week as a heat wave engulfed much of the country at the start of the week, only to give way to milder temperatures and much lower prices by week’s end. The NGI Weekly Spot Gas Average stayed flat on the week at $2.63.
June 22, 2018

Weekly Natural Gas Prices Rise on Heat; Maintenance Leaves Permian Prices in the Dust
Persistent hot weather in the southern and central United States kept the pressure on regional prices this week, while a string of maintenance events led to wild swings in other markets. The NGI Weekly National Spot Gas Average rose 5 cents to $2.63.
June 15, 2018
Listen to the latest episode of our newest podcast NGI's Hub and Flow via: