Markets | Infrastructure | LNG | Natural Gas Prices | NGI All News Access | NGI The Weekly Gas Market Report
Like ‘Nothing Happened,’ Natural Gas Forward Prices Crumble Below $3.00
Massive declines spread across natural gas forward markets for the trading period ending Wednesday, fueled primarily by a return to the warm weather pattern that has characterized most of the winter season.

A quick ramp in production following last week’s historic winter storm also served as a headwind for prices, with March averaging 34.0 cents lower during the Feb. 18-24 period, according to NGI’s Forward Look.
April contracts also took a big hit, falling 19.0 cents on average for the period, while the summer strip (April-October) dropped 13.0 cents on average, Forward Look data showed. Prices for next winter (November-March) posted double-digit losses as well, averaging 10.0 cents lower on the week.
The price decreases across U.S. forward curves were expected following the monstrous rally that took place last week amid the prolonged Arctic blast. The unrivaled cold resulted in widespread power outages and surprising moves by the Texas governor to help restore power to the electric grid. The price slide was led by Nymex futures, which fell for five straight days beginning last Thursday (Feb. 18) and ended with the March contract expiring Wednesday at $2.854/MMBtu. April closed the session at $2.795.
Nothing Happened?
“It is difficult to argue that nothing happened during the month of February, yet that is what the Nymex curve indicates,” said Mobius Risk Group.
Instead, the gas market has been beset by several bearish catalysts over the past week, according to EBW Analytics Group. These include a couple of lower-than-expected storage withdrawals, a much warmer turn in the weather data that has sliced 38 Bcf of demand and a faster-than-expected recovery from record production freeze-offs.
“The market remains severely undersupplied, and Nymex futures are significantly undervalued on a fundamental basis,” EBW said. “Last week’s perfect storm and widespread shortages provided the catalyst for the market to move higher, and the lack of upside price action suggests…a likely period of consolidation before a sustained move higher later in late April or May.”
Given recent price action and the coming multi-week span of generally moderate spring weather, it wouldn’t be surprising to see the market wait another month or two for prices to move to a sustained higher level. However, it’s important to consider that the coming summer period may be vastly different than last year, when Covid-19 was starting to become more widespread in the United States and export demand got crushed.
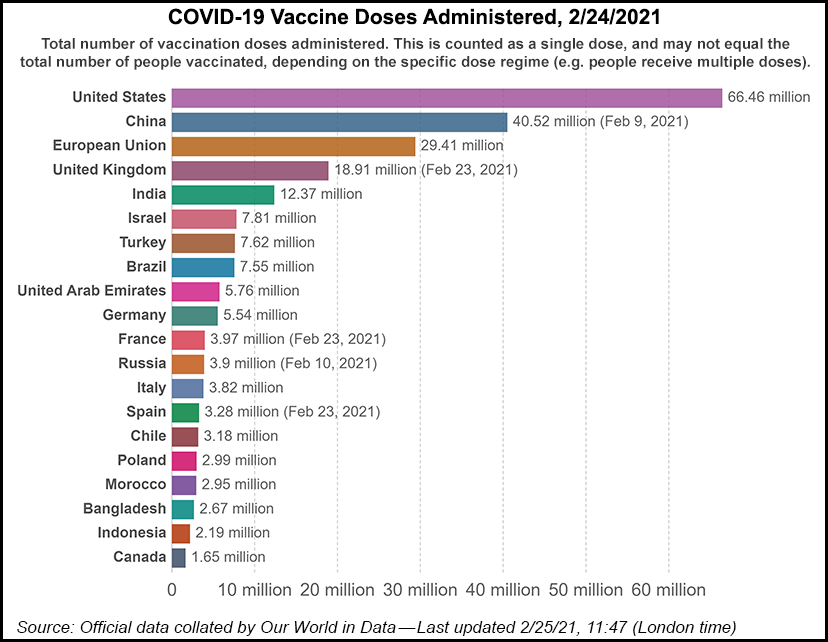
As for the pandemic, several vaccines are now available around the world, including two in the United States, and shot distributions appear to be improving. As of Wednesday (Feb. 24), more than 66 million vaccine doses had been administered domestically, according to researchers at the University of Oxford. This is up from the 4.2 million that had been administered as of Jan 1.
A U.S. Recovery Tracker developed by Oxford Economics said the tracker rose to its highest level in the week ending Feb. 12 since October. Improving health dynamics remained central to the upward trajectory, according to the firm, while increasing mobility, stronger production and looser financial conditions led the weekly gains. Employment tracked sideways, it said, reflecting a still fragile labor market, and demand cooled after a series of fiscally stimulated gains in January.
“Large-state recoveries mostly strengthened, with New York leading the charge,” said Oxford Economics’ Gregory Daco, chief U.S. economist. “Texas will struggle in the very near term after harsh winter weather brought economic activity to a temporary standstill.”
Daco said the colder weather has slowed the pace of vaccinations, which should quickly recover, and the economy continues to benefit from a pronounced slowdown in virus transmission. Employment growth, meanwhile, is set to accelerate in coming months, and with President Biden’s American Rescue Plan likely to lift household incomes, “stronger recovery dynamics should gradually blossom in the spring,” according to the economist.
Oxford Economics expects gross domestic product “to grow 7.1% annualized in 1Q2021 after remarkably strong January retail sales illustrated how fiscal aid and better health conditions will foster a strong recovery,” Daco said. “The economy will advance solidly through the rest of 2021,” and the Federal Reserve Bank “will maintain a very dovish policy stance, focusing on a ‘broad and inclusive’ labor market recovery.”
Meanwhile, the worst of the virus’ dramatic impact on the global LNG market is likely in the past, with analysts predicting few U.S. cargo cancellations this year. LNG pioneer Cheniere Energy Inc. reported this week that it exported 130 cargoes during 4Q2020, flat from the year-ago period. Over the full year, it exported 391 LNG cargoes, down 9% from 2019.
Royal Dutch Shell plc said Thursday consumption held steady in 2020 despite Covid-19 and is on course to expand as economies recover. Shell’s annual global LNG trade report is forecasting a supply-demand gap opening around 2025, with less production coming onstream than previously projected.
For its part, Cheniere said it plans to focus this year on entering into both medium- and long-term contracts to firm up economics on its portfolio capacity and support a stage three expansion at the Corpus Christi terminal in South Texas. The company is on track to bring the third train online at Corpus Christi by the end of March.
Expanding Deficits
Another factor that’s been quietly lingering in the background is storage. For more than a year, U.S. inventories have provided the gas market a healthy cushion to meet spikes in demand.
That started to change as the winter season got underway, even as U.S. demand remained unseasonably light and withdrawals often fell short of expectations. With LNG exports firing on all cylinders and production off highs, U.S. stocks eroded.
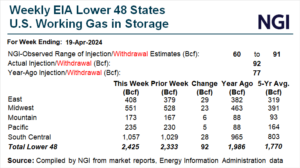
The long-held surplus to the five-year average finally flipped to a deficit after the Energy Information Administration (EIA) on Thursday reported the second largest withdrawal on record for the week ending Feb. 19. The 338 Bcf draw fell short of the 359 Bcf record set in January 2018, but dropped stocks to some 298 Bcf below year-ago levels and to 161 Bcf below the five-year average.
Broken down by region, the South Central region recorded a massive 156 Bcf withdrawal, including an 83 Bcf pull from salt facilities and a 73 Bcf draw from nonsalts, EIA said. The Midwest took out 81 Bcf from storage, and the East withdrew 61 Bcf. Pacific inventories declined by 26 Bcf, while Mountain inventories fell by 14 Bcf. Total working gas in storage was 1,943 Bcf.
The deficit to the five-year average could expand even further next week, according to EBW, with a 300 Bcf shortfall not out of the question.
“We continue to highlight that the fundamental outlook remains overwhelmingly bullish on a long-term basis, but the market may extend its period of consolidation in late winter before resuming its move higher,” EBW said.
The firm pointed out that many analysts have “joined the chorus” in anticipating higher prices later this year, and few, if any, are fundamentally bearish on the 2021 injection season. This has led to a large speculator net-long position. “There are significant fundamental reasons for bullishness, but a large net-long position has already been built up.”
This speculator bullishness, however, has been countered by extensive producer hedging, according to EBW. Producer net short positions have reached their largest net-short level since 2017.
“With access to capital restricted by lenders after last year’s price collapse, however, producers may continue to hedge at high levels, maintaining selling pressure on Nymex futures over the next several months.”
Big Losses
Northeast forward markets experienced more than their fair share of volatility during the trading period through Wednesday. Larger-than-average decreases at the front of the curve were a byproduct of the steep pullback in regional cash prices, and the losses pushed March prices outside of New England back below $3.000.
At Transco Zone 6 non-NY, the March contract plunged 46.0 cents from Feb. 18-24 to reach $2.518, while April lost 18.0 cents to land at $2.349, according to Forward Look. The summer strip was down 9.0 cents to $2.278, while winter 2021-2022 prices were down 6.0 cents to $3.780.
Algonquin Citygate March prices tumbled 88.0 cents fto $3.738, and April dropped 19.0 cents to $3.056. Prices for the summer and the upcoming winter were down 10.0 cents each to $2.484 and $5.870, respectively.
Meanwhile, forward prices in the Permian Basin were comparatively strong as associated gas volumes remained slightly off pre-storm highs. RBN Energy LLC analyst Jason Ferguson said production in the basin was back at 10.34 Bcf/d last Sunday (Feb. 21). Earlier this month, Permian production was around 12.5 Bcf/d.Waha March prices slipped 10.0 cents from Feb. 18-24 to reach $2.990, while April prices dropped a more substantial 21.0 cents to $2.514, Forward Look data showed. Summer prices were down 16.0 cents to $2.681, and the coming winter priced 6.0 cents lower at $3.01.
© 2023 Natural Gas Intelligence. All rights reserved.
ISSN © 2577-9915 | ISSN © 2577-9877 | ISSN © 1532-1266 |