LNG | Daily GPI | NGI All News Access | NGI The Weekly Gas Market Report
Increased U.S. LNG Exports to Asia Said Driving Up Spot Charter Rates
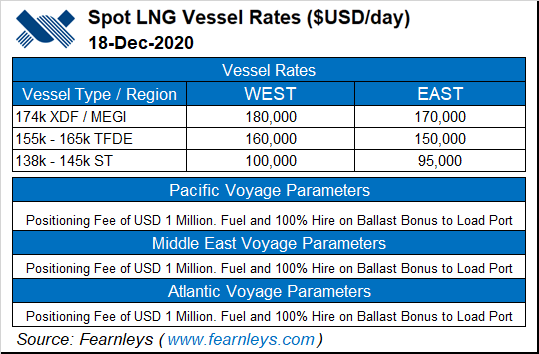
Increased U.S. liquefied natural gas (LNG) exports to Asia this winter have driven LNG vessel spot charter rates to two-year highs of $130,000/day, according to an analyst at shipbroker Poten & Partners.

“It is clear that the U.S. is the swing supplier for the LNG market,” said Poten’s Jefferson Clarke, head of LNG shipping analytics, during a recent webinar.
U.S. exports to Asia are having an “outsized” impact on shipping rates because of the longer routes compared to other producing regions. Many domestic cargoes have recently been routed around South Africa’s Cape of Good Hope because of constraints at the Panama Canal, Clarke said.
“Where cargoes are exported, and how fast the ship is traveling to get there, matters,” he said.
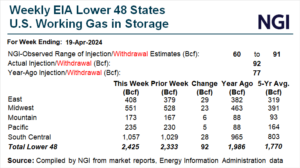
More Lower 48 LNG is heading to Asia this winter as spot prices in the region have hit two-year highs. The prompt month February spot price for delivery to northeast Asia was $10.115/MMBtu on Thursday.
The Poten team does not expect spot charter rates to significantly drop until the end of the winter, whereas as in recent winters rates started dropping after the middle of the season, Clarke said. The shipbroker expects spot charter rate volatility for low and peak demand periods to be about $40,000-60,000/day.
Current spot charter rates published by Norwegian shipbroker Fearnleys AS are even higher. Fearnleys said in a note Thursday the first two months of 2021 “look tight,” but analysts still expect the spot LNG shipping market to balance by the end of the first quarter.
In the first 11 months of this year, 106 U.S. cargoes traversed the Cape of Good Hope to get to Asia, more than twice the 45 trips around the Cape during the same period in 2019, Clarke said. That compared to 154 U.S. cargoes traversing the Panama Canal in the first 11 months of 2020 and the 119 voyages in the year-ago period.
Owners of domestic cargoes were not waiting at the Panama Canal for more than a few days, he said. Instead, they are deciding to go around the Cape if they cannot get a slot through the Panama Canal, as it would be too costly to wait.
In addition, shippers could have had an economic incentive to go around the Cape of Good Hope in the October 2019 shoulder season to wait until Asian spot LNG prices spiked before unloading supplies, Clarke said.
The LNG industry set a record in October with the amount of LNG stil on the water at the end of the month, 17 million metric tons (mmt), being equivalent to 60% to the 28 mmt of the supplies unloaded that month. The ratio has been relatively high this year at mostly more than 50%, further constraining available shipping.
The average LNG voyage globally from January through November took 14.8 days, 8% more than average of 13.7 days in the year-earlier period, Clarke said. The global LNG vessel fleet in 2020 grew by 6% to 529 and is expected to grow another 10% next year, he added.
However, global LNG trade in 2020 is forecast to lonly grow marginally to 362 mmt, equivalent to about 46.4 Bcf/d, compared with 361 mmt in 2019, he said. The market is expected to increase by 3% in 2021 to 371 mmt.
“Yet spot charter levels are at levels that are even higher than last year,” Clarke said.
There are less available ships for spot hire this year because many shippers entered into long-term or medium-term charters to guard against the prospect of missing a loading or delivery because of Covid-19 constraints, he said.
Only 41 vessels in the global fleet were not committed and a number of vessels that were committed were at times sub-chartered for spot deliveries, he said. Despite a growing number of LNG spot charters, the market is illiquid and virtually no vessels were said to be available for immediate spot deals.
Historically, 1.33 vessels have been needed to move every 1 mmt, Clarke said. That number dropped slightly last year to 1.32 vessels for each 1 mmt but it is expected to increase to 1.37 vessels this year, he added. U.S. LNG exports typically need about twice the global average of ships.
At the current global market of 362 mmt, the increase in average ship voyage distances represents about 18 additional vessels needed this year to move about the same amount of supply as last year, he said.
“If 18 vessels were freed in today’s market, we’d be seeing very different rates than we are now,” Clarke said.
Last winter, about 50% of U.S. cargoes went to Europe because Asian prices were not strong enough to support spot imports amid a mild winter, he noted. A colder Asian winter has driven Asian spot prices higher, with only 30% of U.S. cargoes having gone to Europe this year, while most are going to Asia and Latin America.
© 2023 Natural Gas Intelligence. All rights reserved.
ISSN © 1532-1231 | ISSN © 2577-9877 | ISSN © 1532-1266 |