Though widespread summer heat keeps getting kicked down the road, natural gas forward prices strengthened for the trading period ending May 12 as export demand led markets higher.

June forwards rose an average 4.0 cents, with similar gains seen through next winter (November 2021-March 2022), according to NGI’s Forward Look.

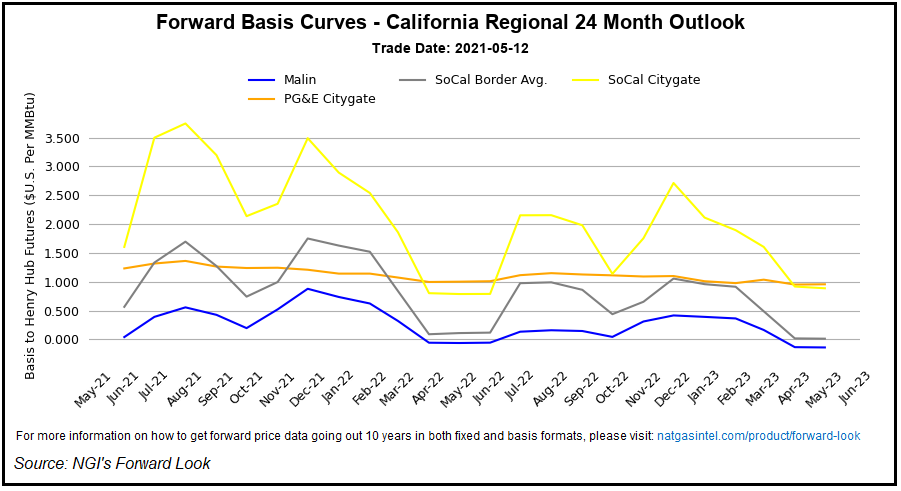
Larger increases were seen in the West, where early season heat combined with projections for an even hotter summer and below-average hydro output to fuel double-digit gains at the front of the curve.

In Southern California, SoCal Citygate June forward prices jumped 11.0 cents from May 6-12 to reach $4.574/MMBtu, Forward Look data showed. This compares to spot prices last June that averaged around $1.970.

The forward curve points to even higher prices later this summer. Forecasters have indicated that much of the potentially record-breaking heat could occur in the West. The Weather Company (TWC) said a hotter-than-average June-August is shaping up on the West Coast.

One reason for the generally hot forecast is La Niña, the periodic cooling of water in the eastern equatorial Pacific Ocean that influences weather patterns near the United States and elsewhere, according to TWC. After reaching a typical peak in late fall, La Niña gradually weakens in the spring. Past summers in similar situations have been quite warm.

“If we look at summers following first-year La Niña winters, we can see a very hot signal across most of the western and northern U.S.,” said TWC chief meteorologist Todd Crawford.

The toasty outlook boosted SoCal Citygate July forward prices up 9.0 cents from May 6-12 to reach $6.516. The balance of summer (June-October) picked up a dime to average $5.850. Even the winter strip tacked on 10.0 cents, averaging $5.790.

Gains were smaller in Northern California. PG&E Citygate June forward prices rose 4.0 cents from May 6-12 to each $4.201, as did the balance of summer, which averaged $4.290. The winter strip climbed only 3.0 cents to $4.320.

“A glimpse at western markets highlights issues which can quickly arise when supply has been discouraged, pipeline capacity has been stagnant, storage capacity has been reduced and reliance on natural gas as a backstop to renewable generation is firmly entrenched,” Mobius Risk Group said.

Preparations Underway

Markets appeared to be pricing in what could be a repeat of last summer, when scorching temperatures drove up demand and resulted in rolling outages in California. Though state regulators have indicated they are better prepared this year, the fact remains that California and other western states rely on power imports to meet demand. And when it’s hot throughout the region, those states may keep the power for themselves.

Southern California Gas (SoCalGas) continues working to complete field testing as part of the storage integrity management plan at the Aliso Canyon storage facility. SoCalGas has temporarily stopped injection and withdrawal activity at Aliso Canyon through May 24 in order to complete the testing.

Inventories at the Los Angeles storage facility were about 63.6 Bcf, or about 75% full, on May 11, the highest stocks at this point in the injection season since at least 2017 and almost 6 Bcf higher than a year ago. Driven by chilly weather, SoCalGas reported that gas was withdrawn from Aliso Canyon 14 times in March.

The storage facility has operated at a restricted level after leaks were discovered in 2015.

In the broader Pacific region, natural gas stocks were about 56% full, according to Energy Information Administration (EIA) data as of April 30.

In related news, California Gov. Gavin Newsom earlier this week expanded the drought emergency proclamation for 41 of 58 counties. He ordered the state’s water board to consider modifying requirements for reservoir releases and take other conservation measures. The declaration also gives the state flexibility in regulatory requirements to mitigate drought impacts.

Meanwhile, the National Oceanic and Atmospheric Administration’s Northwest River Forecast Center has said water supply from The Dalles Dam in Oregon is expected to be nearly 10% below the 30-year norm from April to September.

Poised For Volatility

With weather models struggling to put much widespread heat on the maps, some early concerns over storage may start to ease — at least temporarily — as less natural gas is needed for power generation.

Bespoke Weather Services said models early Friday showed a little strong warming at the very end of the forecast, which could finally provide a wave of more meaningful demand by way of enhanced cooling degree days. However, its confidence in medium-range modeling is below average given the recent bias for models to be too warm.

“As such, we must consider the risk that models again could be jumping the gun, though our expectation is that we do see things turn hotter as we move through June, so it is likely just a matter of pinning down the timing of its arrival,” Bespoke said. “In the nearer term, demand is set to run quite low over the next week or so,” with wind increasing somewhat in the coming days.

On Thursday, the Energy Information Administration (EIA) offered another glimpse into how the light demand has impacted U.S. storage.

The agency reported a 71 Bcf net change in stocks for the week ending May 7, which was in line with expectations but nevertheless came with a few head-scratching data points. For example, EIA announced an implied flow of 75 Bcf. However, the agency reclassified the amount of working gas in storage previously by 4 Bcf, resulting in the net 71 Bcf print.

The reclassification occurred in nonsalt facilities in the South Central region, where total inventories rose by a net 21 Bcf week/week. This included 16 Bcf into nonsalt facilities and 5 Bcf into salts, according to EIA.

The Midwest added 16 Bcf to storage, while the East added 15 Bcf. Pacific stocks rose by 11 Bcf, and Mountain stocks were up by 7 Bcf, EIA said.

Total working gas in storage climbed to 2,029 Bcf, which is 378 Bcf below year-ago levels and 72 Bcf below the five-year average, according to the agency.

Tudor, Pickering, Holt & Co. (TPH) analysts noted that the South Central region has reported four consecutive below-normal injections, taking storage levels down to 9% below the five-year average. Liquefied natural gas (LNG) demand, Mexican exports and industrial consumption are all contributing to strong demand in the South Central region, which also has limited coal-to-gas switching capacity to serve as a correcting mechanism.

“This is creating a particularly strong setup for regional hubs (Henry Hub included) this summer,” said the TPH team.

Furthermore, the analysts said although net imports from Canada are currently running in line with its expectations, they see limited capacity to push this higher given Western Canadian inventories are 14% lower than the five-year average. TPH is modeling end-of-season balance at about 6% below the five-year norm.

“To put further context around this, if Canadian flows to the U.S. increase an incremental 0.5 Bcf/d versus our model, Canadian storage would drop to 25% by the end of injection season,” TPH said.

Looking ahead to the next EIA report, the firm indicated that strong heating demand, which is up 4 Bcf/d week/week, puts its early modeling at a 50 Bcf injection, well below the five-year average of 84 Bcf.

Overall, the EIA’s 71 Bcf figure for the week ending May 7 is still reflective of a “rather tight” supply/demand balance, according to Bespoke, but it expects balances to loosen in the next couple of weeks. “Price action may remain choppy, but we still favor lower versus higher as we move toward June expiration.”

EBW Analytics Group said weakening cash prices may support this theory. The firm indicated that shrinking late-season heating demand could fall from 10.0 gas heating degree days on May 11 to only 1.3 by May 25. Its current projection suggests that weather-driven demand could fall as much as 7.0 Bcf/d week-over-week.

Furthermore, a rise in wind generation toward March levels could detract from power sector gas demand, according to EBW. In addition, a brief decline in LNG feed gas demand during the middle of the shoulder season — while not altering the medium- to long-term outlook — could prove sufficient to allow the June contract to edge lower.

On Friday, NGI data showed feed gas volumes flowing to U.S. LNG terminals holding near 10 Bcf, with several Gulf Coast facilities operating a reduced capacity because of maintenance.

There are other factors that could influence near-term price behavior.

Mobius analysts noted that Israel’s Ministry of Energy instructed Chevron Corp., operator of the Tamar offshore platform, to shut down production. Escalating tensions in the region between Hamas and the Israeli military have the potential to further impact production in the region as the larger Leviathan gas platform continues to run normally. Leviathan could be at risk if onshore infrastructure is damaged. The Tamar and Leviathan gas fields offshore Israel have around 2 Bcf/d of production capacity.

“The concept of U.S. natural gas markets being subject to global geo-political issues is a new risk factor to consider,” said the Mobius team, led by analyst Zane Curry.

The June Nymex futures contract settled Friday at $2.2.961, off 1.2 cents from Thursday’s close. July prices capped the week at $3.018.

Road To Recovery

On a more macro level, the United States continues to get Covid-19 under control, with about 265 million doses administered as of May 12, paving the way for continued economic recovery. The rise in vaccinations drove the weekly advance in Oxford Economics’ U.S. Recovery Tracker, which rose 0.2 points to 91.1 in the week ending April 30. The tracker rose 2.7 points in April, following a 6.7-point gain in March.

“Improving health conditions drove the weekly advance with fewer new Covid infections and greater vaccinations,” said Oxford Economics’ chief economist Gregory Daco. “Mobility continued to rise gently, led by more flights and commuting. Employment posted another gain on increased small business employment and job postings, and fewer layoffs.”

The Labor Department said Thursday the number of Americans seeking unemployment benefits fell last week to 473,000, a new pandemic low. The number of weekly jobless claims — a rough measure of the pace of layoffs — has fallen significantly from a peak of 900,000 in January.

Meanwhile, demand held steady as more restaurant outings and higher retail and recreation spending was offset by weaker credit card outlays and reduced mortgage activity, according to Oxford Economics. Regional recoveries firmed, however, with 38 states recording higher readings. All regions reported stronger conditions during the last week of April as the Midwest caught up to the Southwest and Mountains.

Meanwhile, generous fiscal stimulus and significant improvements in health conditions are expected to support real gross domestic product growth of 7.7% in 2021, “the fastest rate since 1951,” Daco said.