NGI The Weekly Gas Market Report
NGI The Weekly Gas Market Report | Forward Look | Markets | NGI All News Access
Crippled Demand Pressures Near-Term Natural Gas Forwards; Supply Cuts Lift Winter Strip, Beyond
With the possibility of continued cold out the window, the fallout from coronavirus-related restrictions dominated natural gas forward markets for the April 8-15 period.
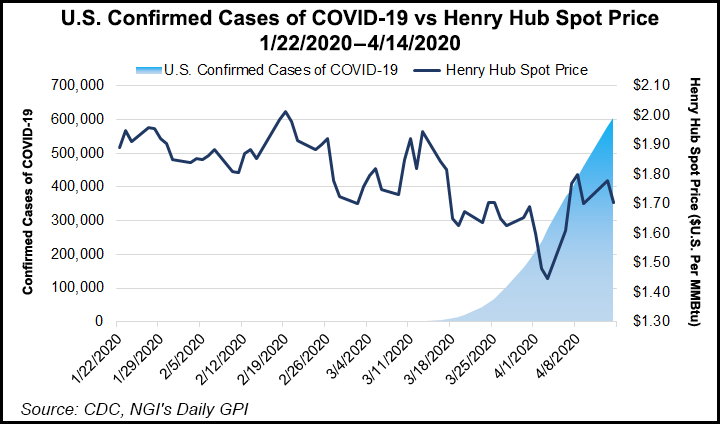
The previous week’s prompt-month gains were slashed by more than half as the pandemic continued to crush demand, with May plunging an average 17 cents and the balance of summer (May-October) dropping 10 cents on average, according to NGI’s Forward Look.
Packages further out the forward curve continued to strengthen, however, as producers have started to tap the brakes on activity. However, gains were limited to a couple of cents at the majority of pricing hubs across the Lower 48, Forward Look data showed.
The dramatic pullback in natural gas forwards followed a surge the previous week that was driven by prospects for cooler weather in April. While much of the eastern United States is in the thick of a late-season cold blast, the latest weather outlooks paint a far milder outlook beyond the weekend.
“The main driver in the shift away from cold is the projected demise of the Alaska ridge (negative Eastern Pacific Oscillation) pattern,” Bespoke Weather Services said. “While we do not yet see a move to a true ”warm’ pattern relative to normal, that is something we are watching for as we move into the month of May, although weather in the first part of May rarely moves the needle much in terms of demand either way.”
Instead, a lot of the price action for natural gas is likely to be dictated by continued demand destruction in the wake of the coronavirus. The market has begun to get a glimpse into how much demand has fallen off the grid, with the Energy Information Administration (EIA) reporting a string of storage statistics that have grown more bearish with each passing week.
On Thursday, the EIA reported a monstrous 73 Bcf injection into natural gas storage inventories for the week ending April 10. While the reported build was within the exceptionally wide range of expectations, it fell on the high side and bested the lowest projection by a whopping 34 Bcf.
“After last week’s number, we revised all of our projections higher, as we simply were not capturing the demand destruction enough, and we have had to do the same after this number,” Bespoke said.
The supply/demand balance is “just obscenely loose,” said the firm, which indicated that the balance of the last two weeks suggests an “impossible” 5.2 Tcf at the end of the season. “Something will have to give, or each month will just get pushed lower once becoming prompt month.”
Ahead of the EIA report, a Bloomberg survey showed projections ranging from 42 Bcf to 78 Bcf, with a median build of 67 Bcf. A Dow Jones poll showed estimates as low as 39 Bcf and produced an average 58 Bcf injection. NGI’s model pegged the build at 57 Bcf.
The 73 Bcf figure is on par with last year’s build for the similar week, but it crushed the 27 Bcf five-year average, according to EIA.
Broken down by region, the South Central region led with a 40 Bcf injection into storage, including 21 Bcf into salt facilities and 19 Bcf into nonsalts, EIA said. East inventories rose by 18 Bcf, and the Midwest added 12 Bcf. The Mountain region injected 3 Bcf, while Pacific stocks stayed flat week/week.
Working gas in storage as of April 10 rose to 2,097 Bcf, 876 Bcf above year-ago levels and 370 Bcf higher than the five-year average, according to EIA.
Putting some of the Covid-19-related demand losses into perspective, Genscape Inc. natural gas analyst Dan Spangler said after adjusting for weather, total natural gas demand in New York was down around 10% since a “stay home” order was declared on March 20.
“The novel coronavirus outbreak has clearly hit New York harder than most states, but gas demand data from the state still serves as an accurate indicator for the effects on demand,” Spangler said.
Nominations data from interstate pipelines in New York account for nearly all gas burned, and sample data correlated with EIA-reported state demand, according to the analyst. Demand also closely follows the weather, so demand per degree day models are generally accurate, he said.
Genscape also has looked at demand across the industrial sector in particular. A sample of industrial meters related to metals showed a massive drop has materialized since the beginning of April.
“Current gas nominations are almost half of what they were during March,” Spanger said. “While some of that decrease is due to reduced heating demand, the current levels are far below the five-year minimum.”
Steel production accounts for the bulk of gas demand in the metals category, and it’s also taken the biggest hit to demand over the past month, according to Genscape. For the week ending April 11, the firm’s gas nominations sample for metals was down more than 30% compared with the same week last year. This aligns with the 33.6% decrease in domestic raw steel production that the American Iron and Steel Institute reported for the same periods.
“Since April 11, the sample has dropped another 10% and is at the lowest levels since 2009,” Spangler said.
While the pandemic has decimated demand and sent near-term gas prices spiraling, the continued turmoil in oil markets has propped up gas prices further out the curve. The last two days of flow data showed total U.S. gas production down around 1.5 Bcf/d, “which could indicate the first signs of a break in U.S. gas supply,” according to Tudor, Pickering, Holt & Co. (TPH) analysts.
Although the usual caution applied, the TPH team said the drop in gas volumes has been driven primarily by the Northeast and Texas, with both showing 0.75 Bcf/d declines, although the Northeast move could be partially because of midstream outages.
“That said, we’ve confirmed with multiple operators now that condensate is becoming a significant issue, and it’s being reflected in local pricing, with Utica Shale condensate currently trading in negative territory,” TPH analysts said.
The firm plans to continue tracking daily data to determine whether this could be the beginning of what it said could be a 6-7 Bcf/d drop in gas supply. On a daily basis, the TPH analysts were seeing sizable shut-ins, “with Continental Resources Inc., PDC Energy Inc. and Cimarex Energy Co. all signifying 20-30% of corporate volumes will be shut-in.
“With most producers selling on the month ahead, we see a stepchange on volumes when the calendar flips over to May 1, which we expect to be a meaningful catalyst for the U.S. gas market.”
The pullback in spending and activity follows a deal by the Organization of the Petroleum Exporting Countries and its allies to slash output by an unprecedented 9.7 million b/d during May and June and a commitment to a series of cuts through the next two years to manage the post-pandemic cycle and the inventory overhang.
Still, the agreement was seen as insufficient, and exploration and production (E&P) companies are making even heftier cuts than those already outlined as they navigate the oil market downturn.
Houston’s ConocoPhillips said Thursday it is shutting in 200,000 boe/d combined in the Lower 48 and Canada, around 25% of output, and cutting more capital spending. In its initial response to the pandemic and price war, the independent in March trimmed capital expenditures (capex) by $700 million, or around 10%, while slowing activity in the Lower 48 and deferring drilling in Alaska. Capex, operating costs and share repurchases are being reduced overall by another $3 billion.
Noble Energy Inc. also revisited its line of defense. The producer last month reduced capex by $500 million, or nearly 30%, to $1.1-1.3 billion. Capex now has been reduced by another 20%, or $350 million, to $800-900 million.
Even the Permian Basin, the Lower 48 darling, is not immune to the drastic measures E&Ps are undertaking to survive the downturn. International Energy Agency analysts said ExxonMobil plans to cut its Permian rig count by 20%, while Chevron Corp. plans to slash Permian spending by nearly $2 billion, equal to half of its global spending cut.
“While in the past, it has taken four to five months for a decline in prices to impact new drilling and a further five to six months for output to start declining, the speed at which the industry adjusts this time has been much faster,” researchers said, citing that U.S. producers have idled 26% of active oil rigs over the past four weeks.
Although the full ramifications of the decreased activity are not yet known, Permian forward prices have fared well against most of the country. That’s not to say forward curves haven’t suffered some losses, but the latest data reflected a brighter picture for regional prices.
Waha May prices dropped 10.0 cents from April 7-15 to reach an average 59.0 cents, but the balance of summer slipped only 3.0 cents to $1.18, according to Forward Look. Further out the curve, the Waha winter strip climbed 8.0 cents to $1.93 and prices for next summer picked up 5.0 cents to reach $1.82.
TPH analysts said Cimarex was the first of what may be an ever-growing list of Permian operators to announce production shut-ins heading into May, “which, combined with what appears to be an industry-wide second quarter frac holiday and structural exit-to-exit declines, should start to materially clean up the Waha hub.”
Specifically, TPH modeled flared gas volumes in the Permian at around 700 MMcf/d in the first quarter, which compares to the firm’s 1.2 Bcf/d decline in volumes by 4Q2020. Additionally, Kinder Morgan Inc.’s Permian Highway pipeline is set to start up early next year with 2.1 Bcf/d of takeaway, “which should move Waha basis, in our view, closer to historical walk-up rates of 10-20 cents versus spot of around $1.32 and the 2021 forward curve of around 70 cents.”
Elsewhere across the country, some late-season weather systems out West propped up demand in the region, which resulted in smaller losses at some key pricing hubs compared to benchmark Henry Hub, which plunged 19.0 cents at the front of the curve.
Northwest Sumas May prices fell 12.0 cents from April 7-15 to reach $1.183, and the balance of the summer dropped 7.0 cents to $1.63, according to Forward Look. The winter strip, meanwhile, rose 3.0 cents to $3.21, as did prices for next summer, which averaged $2.44.
© 2024 Natural Gas Intelligence. All rights reserved.
ISSN © 2577-9915 | ISSN © 2577-9877 | ISSN © 1532-1266 |