Markets | E&P | Infrastructure | LNG | LNG Insight | NGI All News Access | NGI The Weekly Gas Market Report | Regulatory
Global NatGas Market Still Oversupplied in 2020, Weak Pricing Seen Threatening U.S. LNG Shut-Ins
Global natural gas prices are on the rise as November has gotten off to a chilly start, but a warmer forecast for the overall winter season, healthy storage inventories and a glut of new supply expected to enter the market could send 2020 prices spiraling down to the discount levels seen this fall, threatening U.S. exports.
The International Research Institute for Climate and Society (IRI) said enhanced probabilities for above-normal temperatures are predicted for Greenland and varying parts of Australia, Asia, Africa, North America, South America and eastern/northeastern Europe from November-April. “Tilts of the odds” toward above-normal are strongest for November-January in Greenland, northeastern Asia and northern/northeastern North America.
“The tendency toward above normal is weak or absent in central Africa, a significant part of Europe, most of Indonesia and the southern half of India” throughout the November-April period as well as for “east-central Asia from December to February and for small pockets in central North America for December-February,” according to IRI.
An enhanced probability for below-normal temperature is predicted in parts of central Asia and small parts of eastern or central North America through April, and for a small part of India for much of the winter. “Odds are also tilted toward below normal” in eastern Europe and western Asia for the core months of winter, with chilly air possibly lingering into early spring, IRI said.
IRI’s forecast is based on a recalibration of output from several weather models, including that of the U.S. National Oceanic and Atmospheric Administration and the Environment and Climate Change Canada.
Given the uncertainty with long-range weather forecasts, the outlook for global liquefied natural gas (LNG) demand is “a mixed bag” with “not nearly the sort of growth we’ve seen the last couple of years,” Energy Aspects global gas analyst James Waddell told NGI.
In addition to the weather factor, China, the fastest growing demand market for LNG, is bumping against its regasification capacity limits, and the country’s targets in shifting away from coal have “relaxed” a bit in recent months.
“Regas capacity is the real limiting factor,” Waddell said. “In terms of capacity, 2.5 million metric tons/year was added since last winter, but the headroom to keep growing LNG imports just isn’t really there.”
Compounding the issue is that one of China’s largest regasification terminals was damaged in September when a vessel collided with a bridge. Although the terminal has been able to truckload LNG, there has still been a significant drop in regas capacity, putting an “extra brake on Chinese demand,” according to Waddell.
Meanwhile, two new terminals were expected to go online this year, but one has been pushed back to next year and the owners of the other have kept mum on its startup.
Japan, still the number one importer of LNG, could see some renewed buying in the final months of the year as storage inventories were drawn down heavily in August, and a decline in nuclear generation has boosted LNG demand year/year, Waddell said. In South Korea, demand is expected to increase only modestly this winter due to greater nuclear availability offsetting the gains made due to a planned reduction in coal usage from December-March.
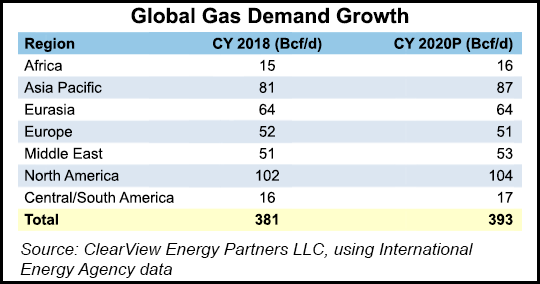
Over the 2016-2018 period, Clearview Energy Partners LLC analysts calculated an average winter (December-February) versus summer (June-August) gas demand swing of around 74 Bcf/d for Organisation for Economic Cooperation and Development (OECD) countries. Asia Pacific accounted for 39 Bcf/d of the increase, including a 32% increase in Chinese winter demand compared to the summer months.
The Americas comprised 30 Bcf/d of the overall hike in demand, and Europe made up the remaining 5 Bcf/d. This suggests that, despite some constraints that have arisen in the Chinese market, OECD Asia Pacific could ramp up LNG imports during the winter, according to Clearview.
CME Group futures data already imply that Japan Korea Marker (JKM) and National Balancing Point (NBP) prices could seasonally increase in winter 2019-2020 from current levels. JKM futures for December settled Wednesday at $6.08, while January was at $5.94 and February was at $6.075. April-September months priced below $5.40, and October settled at $5.545.
NBP December settled Wednesday at $5.184, January hit $5.528 and February hit $5.640. April-October averaged $4.952, according to CME.
If these prices are realized, and absent a further increase in shipping or variable costs, “then we believe U.S. LNG producers might be encouraged to add additional supply to the market,” Clearview analysts said. “On the other hand, given our expectations for CY 2020 global liquefaction capacity additions similar to CY 2020 global LNG demand growth, we could envision U.S. variable LNG cost near JKM and NBP prices again in spring 2020.”
For its part, Energy Aspects is projecting JKM prices to average $6.20/MMBtu this winter, which compares to a nearly $10 average for the winter 2018-2019. The summer is seen averaging just $3.70/MMBtu.
Prices at the Dutch Title Transfer Facility (TTF), another European benchmark, are forecast to average $4.80/MMBtu this winter, down from roughly $8 a year ago. The summer is expected to average $3.10/MMBtu.
“Looking where the curve is, that would mean the curve has to come down quite a bit from where it currently is,” Waddell said.
Meanwhile, the chilly start to November is a welcome development for LNG producers sending cargoes to Europe, seen as the balancing arm for the global market. However, the low price environment and weak summer demand has resulted in the region quickly filling its storage facilities, according to analysts. Europe “is pushing against its limits now,” according to Waddell.
Taking the recent Arctic blast into account, Goldman Sachs Commodities Research analysts have revised upward their estimate of the storage impact of an extreme cold scenario to near 317.83 Bcf from 211.89 Bcf. If realized, such a tightening would be enough to normalize inventories next summer, allowing TTF prices to move back above coal.

“In this scenario, we would expect upside to summer 2020 TTF prices to be limited near $6.20/MMBtu, $1.10/MMBtu above current levels, as any additional rally would risk creating a surplus through gas-to-coal substitution,” with a resulting end-October 2020 storage level that would not only surpass this year’s 1.833 Tcf end-summer storage but also would likely reach the 1.917 Tcf estimated cap, Goldman analysts said.
Given the currently oversupplied environment, Goldman Sachs maintains that coal-to-gas switching alone would not be enough to balance the market and that summer 2020 TTF prices need to move lower to incentivize lower Norwegian exports to Northwest Europe, much like this year.
“Accordingly, we maintain our forecast of summer 2020 TTF prices at $3.90/MMBtu (versus forwards at $5.09/MMBtu), and we reiterate our trading recommendation to short 3Q2020 TTF, currently trading at $5.04/MMBtu,” Goldman Sachs analysts said.

There are some risks to the firm’s outlook for the coming winter and next summer, including a disruption to Russian sendouts in January 2020 in the absence of a Gazprom-Ukraine deal, which could bring significant volatility to winter TTF prices.
Waddell shared that concern and said a disruption to Russian sendouts would wipe out a significant portion of the European market’s supply, leading consumers to draw down storage quickly, which would impact global flows.
But the possibility that Nord Stream 2 (NS2) can finish construction early next year reduces the probability that such a disruption would be long lasting, according to Goldman Sachs. “Further, it is also worth noting that when NS2 is complete and should a more sustainable agreement between Gazprom and the Ukraine is reached, we believe Russia could increase its overall sendouts to Western Europe versus 2019, posing an upside risk to Northwest European supplies next summer.”
Other risks to Goldman Sachs’ summer 2020 TTF view include extreme-cold weather and/or nuclear generation disruptions in Japan or South Korea, which could support Asian LNG imports. So far this winter, however, the narrow JKM-TTF differential suggests the Pacific Basin remains oversupplied, which will likely continue to support strong LNG imports into Europe.
2018 marked the seventh consecutive year in which annual global liquefaction capacity additions exceeded annual global LNG demand growth, according to Clearview. This year is on pace to continue the streak, with the firm projecting a roughly 4 Bcf/d increase in global liquefaction capacity additions in 2019 and a roughly 3 Bcf/d increase during calendar year (CY) 2020.
“If realized, this would exceed the International Energy Agency’s estimated LNG demand growth of around 6 Bcf/d over the same interval. After CY 2020, we estimate the queue of liquefaction projects currently under construction would drop to an average of about 2 Bcf/d/year over the five-year interval from CY 2021-2025,” Clearview analysts said.
But with European storage inventories already at their limits and unsupportive winter weather forecasts, 2020 could be the year in which U.S. LNG exports are pushed back.
“3Q2020 may be when you might see some U.S. shut-ins,” Waddell said. “You have nothing more to balance your incremental supply with anything other than everyday consumption.”
A lot of the gas gets pushed into Europe as a last resort, but regas capacity is stretching to what is possible, a similar trend that took place last April. Although floating LNG is a possibility, with many tankers idling well before the start of the heating season, freight rates are on the rise.
“If it can’t take it through capacity and can’t turn around, there potentially is no real place for LNG to go,” Waddell said.
The most recent U.S. Energy Information Administration (EIA) Short-Term Energy Outlook projects that U.S. LNG exports could rise to around 6.4 Bcf/d next year, up from around 4.7 Bcf/d in 2019, although the ongoing trade war with China could impact the profitability and/or realization of that outlook, according to Clearview.
The majority of U.S. LNG is sold under long-term tolling agreements, with only about 1.6 Bcf/d of total U.S. April 2019 exports of around 4.2 Bcf/d (roughly 37%) being spot cargoes, according to the U.S. Department of Energy. However, no spot cargoes left the United States between May and August.
U.S. LNG sold for an average $5.16/MMBtu through August, which compared to an average Henry Hub price of $2.63 over the same interval, according to EIA.
There is some degree of flexibility on both sides of the equation, according to Waddell. “These low prices are stimulating some demand, particularly in countries that couldn’t afford to pay for LNG when it was $9/MMBtu. This is especially true in South Asia, where infrastructure is improving and we could see more growth.”
However, weather and Russia remain the biggest inflection points this winter, Waddell said. “It’s very hard to trade around a January temperature forecast. Weather is a very real risk.”
© 2024 Natural Gas Intelligence. All rights reserved.
ISSN © 1532-1231 | ISSN © 2577-9877 | ISSN © 1532-1266 |