Markets | NGI All News Access | NGI Data | NGI The Weekly Gas Market Report
With Prices Forecast Higher, 1Q2017 Natural Gas Marketers Declined 2% From Year Ago
Perhaps keeping their powder dry in expectation of forecasted higher prices this year, the nearly two dozen leading natural gas marketers participating in NGI‘s 1Q2017 Top North American Gas Marketers Ranking recorded a 2% decline compared with 1Q2016.
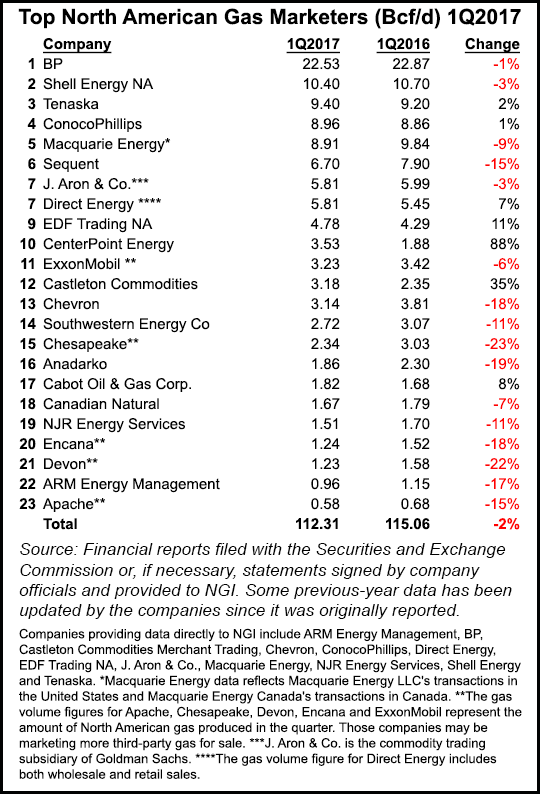
The snapshot of leading gas marketers reported combined sales transactions of 112.31 Bcf/d in 1Q2017, a 2% decline year/year from the 115.06 transacted during 1Q2016. It was the second consecutive quarter with a 2% decline, following two quarters of 7% increases dating back to 2Q2016.
Perennial No.1 BP plc kept a firm grip on the top spot, reporting 22.53 Bcf/d in 1Q2017, a slight decline compared with 22.87 Bcf/d in 1Q2016. The supermajor recently said it is preparing to launch projects that by 2020 will increase production by 800,000 boe/d. By 2020 BP should be producing as much oil and natural gas as it was before the tragic Macondo well disaster in 2010, which forced the operator to sell close to one-third of its global assets to cover litigation costs.
In the second slot, Shell Energy NA reported 10.40 Bcf/d in 1Q2017, a 3% decrease from 10.70 Bcf/d in 1Q2016. Tenaska moved into the No. 3 spot, reporting 9.40 Bcf/d in 1Q2017, a 2% increase from 9.20 Bcf/d in 1Q2016, and ConocoPhillips at No. 4 also reported an increase, up 1% to 8.96 Bcf/d.
Macquarie Energy, at No. 5, reported 8.91 Bcf/d sales in 1Q2017, a 9% decline compared with 9.84 Bcf/d in the same period in 2016.
Other Top 10 companies reporting increases were Direct Energy (5.81 Bcf/d, up 7% from 5.45 Bcf/d), EDF Trading (4.78 Bcf/d, up 11% from 4.29 Bcf/d) and CenterPoint Energy (3.53 Bcf/d, up 88% from 1.88 Bcf/d). CenterPoint’s number moved higher in large part through its acquisition in January of Atmos Energy’s nonregulated natural gas marketing business, which had appeared in NGI‘s rankings since 3Q2008, reporting 0.91 Bcf/d in its final survey. Sequent Energy Management (6.70 Bcf/d) and J. Aron & Co. (5.81 Bcf/d) reported lesser amounts than in 1Q2016.
Other highlights of the 1Q2017 survey include a 35% increase for Castleton Commodities (3.18 Bcf/d, compared with 2.35 Bcf/d in 1Q2016) and an 8% increase for Cabot Oil & Gas Corp. (1.82 Bcf/d, compared with 1.68 Bcf/d in 1Q2016).

First quarter gas volumes took a double hit from lower demand and supply.
“First quarter demand, as measured by gas delivered to customers, was down 4.1% year-over-year, thanks in large part to one of the warmest U.S. winters on record, and to significantly lower gas fired generation” said NGI’s Patrick Rau, director of strategy and research. Gas delivered to power generators averaged 20.6 Bcf/d in 1Q2017, down 14.7% from the average 24.2 Bcf/d in 1Q2016.
“Meanwhile, dry gas production turned in its fourth consecutive lower quarter, falling 3.2% versus the first quarter of 2016.”
Higher natural gas prices may be on the horizon. On Wednesday, the national average was $2.81/MMBtu. Jefferies LLC recently revised its U.S. natural gas price forecast higher for 2017, to $3.26/MMBtu from $3.15, while saying that associated gas output, swelling from the active Permian Basin, should limit 2018 prices to $3.30/MMBtu. Longer term, however, Jefferies expects gas prices to average $3.50/MMBtu.
The U.S. Energy Information Administration (EIA) last month forecast that Henry Hub spot prices would average $3.17/MMBtu this year, with new export capabilities and growing domestic consumption driving prices even higher in 2018 to $3.43/MMBtu. The 2017 price forecast was up 2.3% compared with EIA’s April forecast, when it said spot prices were expected to average $3.10/MMBtu this year.
The NGI survey ranks marketers on sales transactions only. FERC’s Form 552 tallies both purchases and sales. Natural gas trading volumes soared 4.0% in 2015 compared with 2014, likely because of continued increased production, the retirement of coal-fired electricity generators, and a probable increase in consumption because of lower prices, according toa review of the latest 552 data.
NGI analysts are currently compiling 2016 Form 552 data and are awaiting final company submissions to FERC. Preliminary analysis indicates another strong increase in total marketed volumes in 2016, by perhaps as much as 3% year-over-year.
© 2024 Natural Gas Intelligence. All rights reserved.
ISSN © 1532-1231 | ISSN © 2577-9877 | ISSN © 1532-1266 |