U.S. Tight Oil A ‘Weeble,’ Wobbling But Never Falling Down, Says BP’s Chief Economist
Last year’s global oil market was dominated by two actors: U.S. tight oil and the Organization of the Petroleum Exporting Countries (OPEC), and while the Middle Eastern cartel pushed it down, domestic oil bounced right back, BP plc’s chief economist said Tuesday.
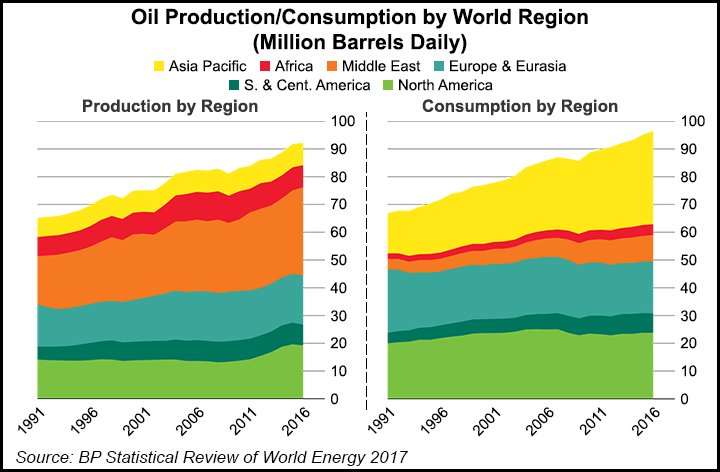
Spencer Dale presided in London over the the 2017 edition of the benchmark “BP Statistical Review of World Energy,” the oil major’s 66th annual edition. He discussed the long-term energy transition underway as operators adapt to nearer-term oil and gas price challenges. The data “clearly” demonstrates the market transition, in the shift to slower growth in global energy demand, demand sharply moving toward the developing economies of Asia, and a marked shift toward lower carbon fuels as renewables grow and coal use plunges.
The United States, said Dale, “remained the world’s largest producer of both oil and natural gas, despite declining production of both fuels in 2016.”
Natural gas demand worldwide rose last year by only 1.5%, slower than the 10-year average, while production climbed a mere 0.3%, the weakest growth in almost 34 years, with U.S. output falling for the first time since the shale revolution.

Dale directed many of his comments to the volatile oil markets, where the United States has been in a battle for price control with OPEC.
U.S. Tight Oil Responding to Prices
“As many people had expected, U.S. tight oil did respond to price signals,” he said. “Production had come off quite sharply in 2015 and 2016, and more recently has started to come back on again and in doing so, has acted to dampen price volatility.
“The other thing we learned about U.S. tight oil was its resilience. It’s quite similar to a toy that I used to have as a child, called a Weeble,” roly-poly toys originated by Hasbro’s Playskool line. “Weebles wobbled, but they didn’t fall down completely. You would push them down and they’d bounce back up again. I think that’s how we should think about U.S. tight oil: it responds to price falls in the short run, but bounces back as the market adjusts.”
OPEC in late 2016 announced it would reduce oil production to increase the pace of bringing inventories back into line.
“That was a reminder to people about the major role the organization continues to play,” Dale said. Last month OPEC extended the pullback to next March.
“As the market moves into balance, this year’s Stats Review provides a good opportunity to consider what have we learned about the behavior of both during this cycle,” Dale said. “Consider first U.S. tight oil, which didn’t exist during the last oil price cycle, and so we are learning about it in real time.”
Based on what’s known today, “perhaps the most important thing is that there is no such thing as the behavior of U.S. tight oil. The Permian is very different to Eagle Ford, which is different to Bakken. So beware generalizations.”
The short-cycle nature of unconventional drilling “meant U.S. tight oil did respond far more quickly to price signals than global conventional oil. Rigs started to fall around four to six months after oil prices peaked in the middle of 2014, and picked up even more quickly — within three or four months — once prices started to turn at the beginning of last year.”
”Amazing’ U.S. Productivity
Lower activity quickly fed through into slower output growth. In the first half of 2015, less than a year after peak oil prices, tight oil production rose by only 0.1 million b/d, versus more than 0.5 million b/d in first half of 2015. Similarly, U.S. tight oil has grown solidly in the first half of this year, following the trough in prices in the spring of 2016.
“Some commentators have talked about the surprising resilience of U.S. tight oil,” Dale said. “But it’s important to be clear about what we mean by ‘resilience.’ Tight oil lived up to its billing: it did respond far more quickly to price changes than global conventional oil and, as such, dampened price volatility on both the downside and, more recently, the upside.”
The “amazing gains productivity” among U.S. tight oil producers also cannot be ignored. “Despite rigs in the Permian falling by over 75%, output continued to grow. Put differently, a rig operating in the Permian today is equivalent to more than three rigs at the end of 2014.”
“Stability and energy markets don’t go together,” said Dale, who was presiding over his third statistical review. “It’s like England and summer or, perhaps after last week, predictability and elections. Booms and busts; rebounds and reversals are the norm.
“But the movements and volatility seen last year in energy markets were particularly interesting since they were driven by two separate forces: the continued adjustment to the short-run — cyclical — shocks that have rocked energy markets in recent years, overlaid by the growing gravitational pull from the longer-run energy transition that is underway.”
The need for near-term adjustment was “most obvious within the oil market; the coal market…also faced its own near-term surprises…But these cyclical adjustment mechanisms are being increasingly affected by the longer-run transition that is shaping global energy markets.
“On the demand side: the shift in the center of gravity to fast-growing developing economies, led by China and India; together with a slowing in overall energy growth as it is used ever more efficiently. And on the supply side, the secular movement towards cleaner, lower-carbon energy, led by renewable energy, driven by environmental needs and technological advances.”
Oil Still Dominant U.S. Fuel
Specifically in the United States, BP reported that domestic oil and gas production last year was “sufficient” to meet 87% of consumption, down from 91% in 2015. U.S. renewables in power rose by almost 17% from 2015, but the country fell to the world’s second largest consumer after China.
Also, U.S. carbon dioxide emissions from energy use were found to decline by 2% year/year, faster than the 10-year average decline of 1.1%. A decline in coal consumption in the United States, down by almost 9% from 2015, outweighed increases in renewables (16.9%), oil (0.5%), natural gas (0.5%), hydro (5.9%) and nuclear (0.7%).
Oil remained the dominant fuel in the United States last year, accounting for 38% of the country’s energy consumption. Natural gas consumption, 32% of the U.S. total, rose by only 0.3 Bcf/d in 2016 to 75.1 Bcf/d, less than the 10-year average growth of 1.4 Bcf/d. The United States also remained the world’s largest consumer of natural gas in 2016, with 22% of global demand.
© 2024 Natural Gas Intelligence. All rights reserved.
ISSN © 2577-9877 | ISSN © 2158-8023 |