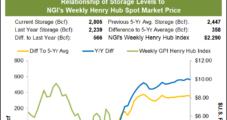
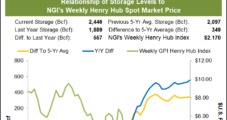
During one of the hottest weeks of the summer so far, natural gas prices rallied in the final days of June. New England prices led the way given pipeline maintenance in the region, lifting NGI’s Weekly Spot Gas National Avg. up 44.5 cents to $2.630 during the four-day June 26-29 trading period for June gas…
Topic / NGI Weekly Gas Price Index
SubscribeNGI Weekly Gas Price Index
Articles from NGI Weekly Gas Price Index
NGI’s July 2023 Bidweek Survey Holiday Publishing Schedule
In observance of the U.S. Independence Day holidays on Monday, July 3, and Tuesday, July 4, NGI’s Bidweek Survey for July 2023 will be published on Wednesday, July 5. Please also see NGI’s full 2023 Publishing Calendar.
June 28, 2023
Weekly Natural Gas Spot Prices, Futures Notch Notable Gains – Again – as Demand Mounts
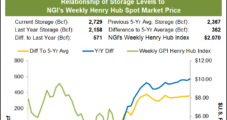
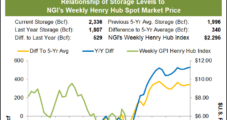
Weekly cash prices forged ahead a third straight week as heat intensified and production remained mired in a maintenance-induced lull. NGI’s Weekly Spot Gas National Avg. for the June 20-23 period advanced 22.0 cents to $2.185. The covered period was shortened by one session due to the Juneteenth holiday on Monday. Conditions during the week…
June 23, 2023
Weekly Natural Gas Cash Prices, Futures Advance in Tandem as Southern Heat Strengthens
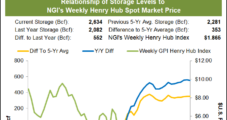
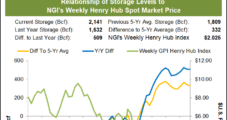
Weekly natural gas cash prices progressed again as production declined notably and temperatures heated up in the South to bolster cooling demand. NGI’s Weekly Spot Gas National Avg. for the June 12-16 period climbed 7.5 cents to $1.965. It advanced 8.0 cents the prior week. Leading gainers included Tenn Zone 1 non-St. 87, up 65.5…
June 16, 2023
Weekly Natural Gas Spot, Futures Prices Rebound On Forecasts For Intense Heat
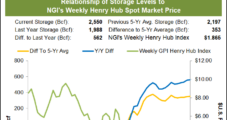
Weekly natural gas cash prices pressed forward alongside a futures rally and forecasts for intensifying heat in the second half of June. NGI’s Weekly Spot Gas National Avg. for the June 5-9 period gained 8.0 cents to $1.890/MMBtu. The average had declined the prior week in concert with a futures slump. At the end of…
June 9, 2023
Weekly Natural Gas Cash Prices, Futures Stumble Amid Unfavorable Fundamentals
In a holiday-abbreviated period in which futures struggled, weekly cash prices failed to sustain early momentum and finished in negative territory. Spot markets started the week with solid gains before dipping lower late in the covered period. The late declines sent NGI’s Weekly Spot Gas National Avg. for the May 31-June 2 period down 24.0…
June 2, 2023
Soft Demand, Stout Supplies Bruise Weekly Natural Gas Spot Prices, Futures
Weekly natural gas cash prices lost ground for the third time in May, hampered by strong supply levels and weak demand across much of the Lower 48. NGI’s Weekly Spot Gas National Avg. for the May 22-26 period fell 14.0 cents to $1.910. Conditions during the covered period were fundamentally unfavorable for bulls: Production held…
May 26, 2023

Weekly Natural Gas Spot Prices, Futures Advance Amid Signs of Production Pullback
Weekly natural gas cash prices snapped a May losing streak, bolstered by expectations that production will scale back in the coming weeks and months. NGI’s Weekly Spot Gas National Avg. for the May 15-19 period rose 33.5 cents to $2.050/MMBtu. The average had declined each of the two previous weeks amid pleasant weather. Weather conditions…
May 19, 2023
Weekly Natural Gas Spot Prices Stumble; Futures See-Saw But Finish Strong
Weekly natural gas cash prices fell again amid benign shoulder season weather and stout supplies. NGI’s Weekly Spot Gas National Avg. for the May 8-12 period slumped 15.0 cents to $1.715. The average dropped 30.0 cents the prior week. Production pulled back early in the week amid maintenance events and wildfires in western Canada. But…
May 12, 2023

Weekly Natural Gas Spot Prices, Futures Fall as Demand Dips, Supplies Swell
Weekly natural gas cash prices dropped amid mild temperatures and weakening demand across much of the Lower 48. NGI’s Weekly Spot Gas National Avg. for the May 1-5 period fell 30.0 cents to $1.865/MMBtu. Conditions during the week largely favored bears. Production held around 100 Bcf/d most days – well above year-earlier levels and within…
May 5, 2023
Listen to the latest episode of our newest podcast NGI's Hub and Flow via: