Markets | NGI All News Access | NGI Data
Weekly Natural Gas Prices Slump on Shoulder Season Demand; AECO Trades Negative
With generally moderate May weather equating to a lack of significant heating or cooling demand during the week ended Friday, natural gas spot prices trended lower; theNGI Weekly National Spot Gas Average fell 11 cents to $2.32/MMBtu.
The biggest mover for the week was NOVA/AECO C, which saw a repeat of last fall’s negative trades as maintenance restrictions combined with strong production and warmer temperatures to sink daily prices in Western Canada to a new all-time low during the week. On a weekly basis, NOVA/AECO C tumbled C$1.18 to average C21 cents/GJ.
In the Northeast and Appalachia, light demand contributed to mostly weaker prices throughout the region — though some shoulder season maintenance saw upward pressure on Transco Zone 6 for part of the week. Algonquin Citygate fell 23 cents to $2.47, while Transco Zone 6 New York finished a nickel higher at $2.56.
West Texas bounced back somewhat after seeing some of the lowest spot prices since the 1990s last week. Waha climbed 24 cents on the week to average $1.75, while El Paso Permian added 10 cents to $1.53.
Natural gas futures fell for the third straight session Friday, with the market sorting through the storage and production outlook after the first injection of the season came in larger than expected. The June contract settled at $2.711 Friday, down another 1.5 cents after a 2.8 cent sell-off the day before. Week/week, the prompt month dropped 6 cents after settling at $2.771 the Friday before.
“The entire natural gas strip again came under pressure” Friday, attempting to rally in the morning “before sellers pushed June prices right back down to $2.70 support,” Bespoke Weather Services said. “The strip deteriorated through the day as well, with some of the most intense selling” occurring in the fall and winter months.
“This is evidence of the market continuing to price in the looser” Energy Information Administration (EIA) storage report Thursday “and loose daily balance data from record production levels and weaker burns” driven by falling nuclear outages and “short-term weather that is far from supportive,” Bespoke said. While support has been firm at $2.70, the market’s next move could be lower “unless we add a decent number of gas-weighted degree days over the weekend or see data materially tighten.”
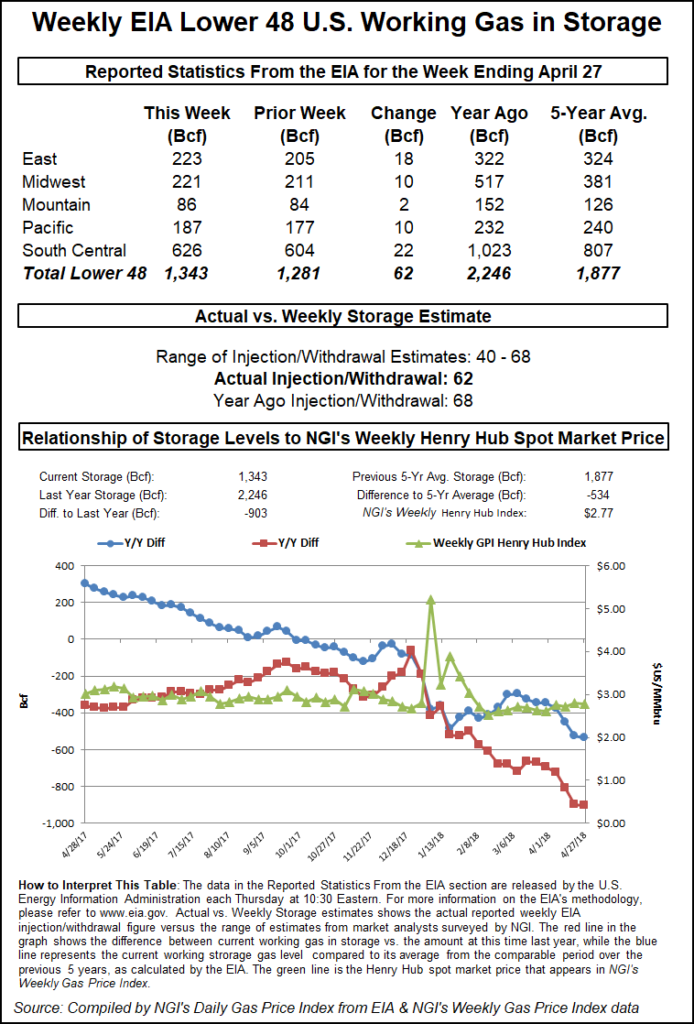
EIA reported a 62 Bcf injection into Lower 48 gas stocks for the week ending April 27, about 10 Bcf looser versus surveys that had anticipated a build of around 51-52 Bcf. Last year, EIA recorded a 68 Bcf build for the period, and the five-year average is an injection of 69 Bcf.
Shortly after the 10:30 a.m. ET release of the number, the June contract — already down after selling earlier in the morning — dropped about 2 cents to around $2.700-2.710. By 11 a.m. ET, June was trading around $2.705, down about a nickel from Wednesday’s settle.
Prior to the release of the final number, a Reuters survey of traders and analysts on average had called for EIA to report a 52 Bcf injection, with responses ranging from 40 Bcf to 68 Bcf. A Bloomberg survey had produced a median build of 51 Bcf, with a range of 40 Bcf to 62 Bcf.
IAF Advisors analyst Kyle Cooper had predicted a 53 Bcf injection, while Genscape Inc. had called for a 55 Bcf injection. Intercontinental Exchange EIA storage futures settled Wednesday at an injection of 55 Bcf for the upcoming report.
The larger-than-expected injection Thursday came after a string of consecutive bullish misses — withdrawals driven by colder-than-normal April weather.
Total working gas in underground storage stood at 1,343 Bcf as of April 27, versus 2,246 Bcf last year and a five-year average inventory of 1,877 Bcf. The year-on-year deficit increased slightly week/week from 897 Bcf to 903 Bcf, while the year-on-five-year deficit widened from 527 Bcf to 534 Bcf, EIA data show.
By region, the largest build came in the South Central at 22 Bcf, with EIA reporting 8 Bcf injected into salt and 15 Bcf injected into nonsalt. The East region saw a build of 18 Bcf for the week, while 10 Bcf was injected in both the Midwest and Pacific regions. The Mountain region saw a 2 Bcf build for the week, according to EIA.
“Weather-adjusted the market was about 1.0 Bcf/d oversupplied,” according to analysts with Tudor, Pickering, Holt & Co. (TPH). The “warmer-than-normal weather” means a likely decrease in heating degree days (HDD), but “there are growing expectations” that it may cause cooling degree days (CDD) to “rise faster than normal and in turn, suppress the effective rate of injection.
“Over the past five years, CDDs typically surpass HDDs in late May/early June. If it occurs earlier this year, demand will be stronger than expected,” analysts said. “Northeast dry production was about 26.8 Bcf/d and is beginning to show signs of life” as the Rover Pipeline’s Phase 2 gets closer to full service, estimated by late May or early June. Liquefied natural gas exports also rose around 420 MMcf/d week/week “as both Sabine Pass and Cove Point saw increased inlet volumes.”
Societe Generale analyst Breanne Dougherty told clients the storage picture appears bullish even as the market appears unconcerned with current deficits.
“If storage is in fact the bellwether for market sentiment, something somewhere should be ringing, but maybe the market has put on its noise-canceling headphones?” Dougherty said. “The first net storage injection of the 2018 season came in stronger than expectation…but it is important to note that it comes a few weeks later than normal. Storage optics are bullish to us.
“We are bullish relative to the curve,” Dougherty added. The firm’s price average for the balance of 2018 is $2.97, versus the Nymex curve priced recently at $2.78. “We are less bullish relative to the market” for 2019 at $2.79, versus $2.70 for the curve. “We continue to highlight core summer 2018 contracts as buy opportunities at current price levels in particular (August 2018) and also recommend looking at first quarter 2019 given the potential for those contracts to see significant speculative trading upside if our summer 2018 base case scenario materializes.”
Still, signs pointing to recent production growth — and more to come — remain bearish for natural gas, according to EBW Analytics Group CEO Andy Weissman.
Recently released EIA production data for the month of February “was startling in two different respects,” he said. First, in February…dry gas production rose by a whopping 1.6 Bcf/d — a new record — even though many wells were shut in due to freeze-offs and drilling of new wells typically falls off sharply in mid-winter…
“Just as significantly, crude production rose by 260,000 b/d. The average increase of 120,000 b/d per month in January and February provides further evidence that EIA’s estimate of growth in oil production this year is far too low. With much higher-than-expected oil production comes much higher output of associated gas.”
Oil drilling, particularly in the Permian Basin, fueled the return of 11 rigs in the United States for the week ended Friday, according to data from Baker Hughes Inc. (BHI), marking the 11th consecutive week the domestic tally has increased.
The continued growth in oil drilling supports the bearish natural gas thesis delivered earlier in the week by analysts with Raymond James & Associates Inc., who lowered their 2019 price forecast from $2.75/Mcf to $2.25 based on a robust supply outlook. The analysts said growth in associated gas production — especially from the Permian — has created an inverse relationship between natural gas and crude prices.
Nymex West Texas Intermediate crude oil futures settled just under $70/bbl Friday at $69.72, up $1.29 on the day.
In the spot market, prices in Western Canada averaged in the negatives on the way to a new all-time low, while forecasts for temperatures and demand to moderate into the weekend in the East accompanied double-digit losses there; the NGI National Spot Gas Average fell 6 cents to $2.24.
In Canada, NOVA/AECO C continued to chart new lows Friday, falling C18 cents to finish with a negative C1 cent average — the lowest average spot price NGI has ever recorded at the Western Canada point. This comes after AECO saw trades cross over into negative territory — but not on an average basis — on Thursday.
AECO has seen negative spot price trades before, as last fall prices there went as low as negative C29 cents on Sept. 27, 2017, the lowest single trade NGI has recorded there.
“We’ve been warning about May/June spot pricing” at AECO for months, TPH analysts said Friday. “With significant maintenance from now until the third week of June, we expect AECO will continue to be prone to pocket change pricing. In terms of inventories, we got our first build of 2018, adding 4 Bcf to storage, relative to our 3 Bcf forecast.
“We’re looking for a 4 Bcf build again next week and then things get really interesting,” the TPH team said. “Since May maintenance kicked off, we’ve seen field receipts drop by 0.5-0.8 Bcf/d as pipe congestion and price induced shut-ins limit supply. However, exports have only dropped by 0.2-0.3 Bcf/d, resulting in a tightening of the supply/demand balance. Ultimately, this tightening gets reflected in storage numbers, and current flow data suggest weekly builds of just 1.5 Bcf.”
TPH’s team said it would be watching the short-term trend given the potential for it to eventually drive AECO spot prices higher, predicting that if it continues, “today’s nickels and dimes are likely to become loonies and toonies in the second half of 2018.”
Prices sold off heavily across the Northeast and Appalachia Friday as unseasonably hot temperatures along the East Coast during the week were expected to cool off into the weekend.
Radiant Solutions was calling for temperatures around 20 degrees hotter than normal along the Interstate 95 corridor Friday — including highs in the 90s in some places — to drop to around normal by Sunday, with highs in the 60s and 70s and lows in the 50s and 60s.
Algonquin Citygate tumbled 34 cents to $2.10, while Transco Zone 6 New York plummeted 62 cents to $2.07.
Further upstream in Appalachia, Dominion South dropped 15 cents to $1.99, while Texas Eastern M2 30 Receipt dropped 17 cents to $1.95.
Genscape Inc. was calling for demand in the Appalachia region, including New York and New Jersey, to drop to around 6.5 Bcf/d over the weekend, down from the recent seven-day average of 10.28 Bcf/d and well below the recent 30-day average of 12.23 Bcf/d. The firm’s New England forecast showed demand falling to just under 2 Bcf/d over the weekend after reaching 2.46 Bcf/d Friday.
“New York averaged nine combined degree days Thursday, which is just about the lowest it’s been since the start of April, and weather was forecast to be even closer to that 65 degree mark today,” Genscape Inc. analyst Josh Garcia told NGIFriday.
As of Friday, Genscape’s Appalachian demand forecast “is the lowest it’s been since 2015,” Garcia said. “Furthermore, Tetco’s M3 maintenance from Uniontown to Bedford” in Pennsylvania was lifted earlier in the week, “so the Southern 36-inch M3 line is no longer maintenance-constrained.”
In South Texas, Tennessee Zone 0 South fell 3 cents to $2.53, while Texas Eastern S. TX finished a penny higher at $2.65.
A flow restriction reported earlier in the week on the Natural Gas Pipeline Co. of America (NGPL) system in South Texas had been lifted as of Friday, according to Genscape. Earlier in the week, NGPL “restricted southbound capacity from 344 MMcf/d to 150 MMcf/d onto Segment 22 beginning May 3 due to horsepower issues at CS 300 during a force majeure event,” Genscape analyst Vanessa Witte said.
“This issue has since been resolved; operating capacity at Segment 22 taken from ”Sta 341 to Sta 302’ is expected to increase back to 344 MMcf/d as of May 4. The force majeure at CS 300 beginning May 1 will still be in effect until further notice, which is reducing southbound capacity through Segment 22 by around 10%,” Witte said.
“Nominations at ”Sta 341 to Sta 302’ decreased to 148 MMcf/d on May 3, however nominations at NET Mexico were somewhat sustained by additional receipts from intrastate interconnects downstream of CS 300.”
© 2024 Natural Gas Intelligence. All rights reserved.
ISSN © 2577-9877 | ISSN © 1532-1258 |