Small price gains were seen along U.S. natural gas forward curves for the Jan. 7-13 period, but they did not tell the whole story. Volatility was in full swing as weather models continued to tease the market with signals that truly frigid winter weather may loom. February prices averaged 5.0 cents higher for the period, while the balance of winter averaged 4.0 cents higher, according to NGI’s Forward Look.

natural gas storage trajectory

Even smaller changes were seen further out the forward curve, mimicking the modest movements along the Nymex futures strip.

While the end result left prices not too far removed from where they started, the intraday trading patterns were anything but subdued. For example, on Wednesday, the February Nymex futures contract climbed to a $2.826/MMBtu intraday high, which was up 7.3 cents from Tuesday’s close. However, by the end of the session, the prompt month retreated back to $2.727, off 2.6 cents day/day and nearly even with where prices stood on Jan. 7. 

In fact, the entire Nymex strip was essentially flat on the week, with the balance of winter (February-March) settling Wednesday at around $2.710; summer (April-October) at about $2.800; and winter 2021-2022 (November-March) at around $3.020.

Though production and export demand provided support early Wednesday, stubbornly mild weather models threw a wet blanket on the momentum, as had been the case for much of the week. Weather data initially had teased colder air moving into the United States by around Jan. 23, but the models kept “kicking the can down the road.”

On Thursday, however, Bespoke Weather Services said it was finally seeing colder days progress forward in the forecast, rather than constantly being “stuck” in the mid- to late 11- to 15-day outlook. “This will be true cold air coming out of Canada, as opposed to the ‘storm-induced’ chill that has been the best the pattern could do so far this season.”

Friday’s outlook didn’t change much, but Bespoke said the pathway to reach the frigid air may be “wild.” Because the strongest cold is expected from the Plains to the Pacific Northwest, it’s not an “extreme” pattern to the cold side in terms of national demand, but easily the coldest all season long.

“We continue to believe this can give us a couple of colder weeks before potentially moderating after the first week or so of February,” Bespoke said.

In general, cold weather has been the missing link for the gas market this winter, with production well off November highs and liquefied natural gas (LNG) demand at or near record levels.

Lasting Impressions

On Friday, NGI data showed feed gas volumes climbing back above 11 Bcf on what EBW Analytics Group called a “radical” rise in international LNG markets. The firm said reports of some LNG buyers paying nearly $40/MMBtu for a cargo are triple what analysts considered a short-lived bullish price earlier this winter. This is the most recent demonstration of the extreme price movements occasionally required to balance natural gas markets, it said.

Once the market exhausts normal balancing mechanisms, extreme price movements may be required to achieve the next increment of demand reduction, according to the firm. Particularly within short timeframes, supply and demand may be relatively price inelastic. They occasionally require “immense price moves. Just a few years ago, the bomb cyclone in the United States drove spot natural gas prices at Transco Zone 6 to $175/MMBtu in January 2018,” EBW said.

The chances for a sharply bullish outcome in the U.S. natural gas market over the next year, while not the most likely scenario, is higher than widely recognized, according to the firm. A multitude of factors could curb the threat of upside risks entirely, but the recent surge in global LNG prices, “with cargoes trading $25-plus over and above then-bullish prices just weeks ago” is the latest reminder that extreme price outcomes are possible.

Wood Mackenzie said the current cold spell in the northern hemisphere is paving the way for a tighter global gas market throughout the year, even with global LNG supply expected to increase by 17 million tons in 2021 as U.S. terminals run at full capacity. Low temperatures mean that storage levels in Europe are already more than 15 billion cubic meters lower than last year and close to the past five-year average, according to the firm. On the other hand, expectations of higher coal and European carbon prices, also partially driven by the cold spell, provide headroom for higher European summer gas demand.  

“Global prices reached record lows in 2020,” noted Wood Mackenzie Vice President Massimo Di Odoardo. Title Transfer Facility (TTF) was averaging $3.20, while Asian LNG spot was averaging $3.90. This year “will show a stark difference. We anticipate TTF averaging $5.60/MMBtu and Asian LNG spot averaging $7.60/MMBtu.”

Tudor, Pickering, Holt & Co. (TPH) analysts struck a similar tone. Although the Japan Korea Marker front-month contract was set to roll forward to March at a “much more modest” price of around $10.00, the heady days of $30-plus pricing are to linger in the record books.

Furthermore, the disruptive events of the last month may continue to reverberate through the global gas market for some time to come, according to TPH. The biggest knock-on impact right now is in Europe, analysts said, where storage continues to draw at a record rate, down 231 Bcf over the past seven days. This is around 70% above normal draw rates, with the five-year average standing at 137 Bcf.

“While March pricing is suggesting the start of a normalization, the February cargoes have been spoken for, and most of them will continue to land in Asian markets,” the TPH team said.

This means there may be “at least another month” of strong pulls on European storage, which currently is just 2% above the five-year average. Analysts expect this to drop to 10% below the five-year average by the end of March; however, they noted that Ukrainian storage remains 26% above historical levels.

Even with the placement of the polar vortex in question, TPH said the damage being inflicted on European storage would trickle back to the U.S. market by the second quarter, with higher U.S. LNG utilization expected to push Henry Hub to $3.35 by this summer.

Whittling Storage

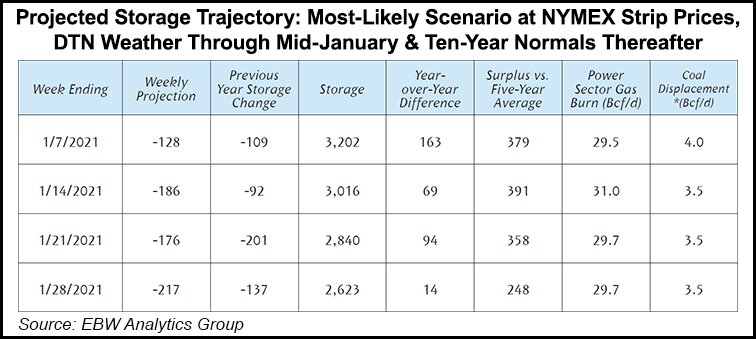
For now, the surge in demand, all the more impressive considering the dozens of LNG cargo cancellations a few months ago, has gas prices eyeing a move toward $3.00, if the weather cooperates. The colder temperatures to date may advance the drawdown in domestic storage inventories, which have remained well above historical levels so far this withdrawal season.

On Thursday, however, the latest government storage data continued to chop away at the surplus to the year-ago level. The Energy Information Administration (EIA) said stocks for the week ending Jan. 9 fell by 134 Bcf, which was on the higher end of market surveys and several Bcf above consensus. NGI had modeled a 135 Bcf withdrawal.

Participants on The Desk’s online chat Enelyst appeared to be impressed by the triple-digit pull, with some indicating it was the tightest figure since October. The draw was seen as an indicator that Lower 48 stocks could fall below 1.5 Tcf by the end of winter “if it gets cold.”

“It makes the summer 2021/winter 2022 a lot more interesting,” said one market observer.

Natural gas traders didn’t appear to agree, as prices briefly bounced after the EIA report, but then quickly retreated and fell into the red. However, Huntsville Utilities natural gas scheduler Donnie Sharp said the pullback was more about the market being “oversold” than anything.

Broken down by region, the Midwest led with a 44 Bcf draw, and the East followed with a 39 Bcf pull, according to EIA. South Central inventories fell by 37 Bcf, which included a 31 Bcf decline in nonsalt facilities and a 6 Bcf fall in salts. Single-digit withdrawals were seen in the Mountain and Pacific regions.

Working gas in storage stood Jan. 8 at 3,196 Bcf, which was 126 Bcf above year-ago levels and 218 Bcf above the five-year average, EIA said.

Mobius Risk Group said extrapolating a single data point is “often fraught with peril” and there are several factors to consider when determining whether the result should be projected forward. The firm noted that salt inventories in the South Central region pared its year/year surplus to 6 Bcf, while the region overall trimmed its overhang to 44 Bcf. The Midwest also sharply reduced its surplus, according to the EIA data.

Regardless, Mobius views the temperature realizations in the second half of January, particularly the last seven days of the month, as carrying more weight than EIA’s 134 Bcf pull. “By Monday, the implications of today’s result will be long forgotten with scrutiny on what the six- to 10-day forecast looks like compared to the current Jan. 23-28 temperature predictions.”

That sentiment may already be taking shape. The Nymex February futures contract jumped 7.1 cents on Friday to close the week at $2.737. March rose 6.6 cents to $2.696.

Northeast Spikes

Few U.S. markets deviated much from the price movements seen along the Nymex strip. Still, with talks of a polar vortex descending on the United States at the end of the month and possibly lingering into early February, sharp gains were seen in constrained New England markets and throughout the Rockies.

It’s still early to determine where the polar vortex may develop, according to AccuWeather. The forecaster said early data indicated that the core of the frigid air might take aim from central Canada to the northern Rockies and the northern Plains.

Storms and buckles in the jet stream that develop ahead of blasts driven by changes in the polar vortex often help determine where and when some of the coldest air will go, according to AccuWeather. That may be the case this weekend as a storm associated with a large southward bend in the jet stream was forecast to settle from the Midwest to the Northeast. However, the air is forecast to moderate as it passes over the relatively mild waters of the Great Lakes.

“This is the first sign of a change across the northern latitudes following the polar vortex displacement,” said AccuWeather’s Paul Pasterlok, lead long-range meteorologist.

A bigger discharge of cold associated with the polar vortex displacement is still in the cards, but it has been delayed for North America. Though temperatures have been well above average across most of Canada this winter, once Arctic air takes root over Canada, AccuWeather said the stage could be set for some of the bitterly cold air to move southward.

“The most persistent frigid air will aim from central and southwestern Canada, the northern Rockies and the interior Northwest from late January to early February with temperature departures of 10-20 degrees below normal,” Pastelok said.

The Arctic air will likely come in waves because of storms rolling through with some moderation between reinforcing shots, he said, especially from the Midwest to the East. From Jan. 24-28, AccuWeather expects single-day temperature departures in the northern Plains and Midwest to average 10-20 degrees below normal, while farther east, temperatures could be 8-16 degrees below normal.

Against that backdrop, Algonquin Citygate February prices shot up a whopping 49.0 cents from Jan. 7-13 to reach $5.982, according to Forward Look. Prices for the balance of the winter climbed 30.0 cents to $5.080, while the summer strip slipped 1.0 cents to $2.490. Winter 2021-2022 prices also posted notable gains, rising 18.0 cents to $5.890.

Farther West in the Rockies, Northwest Sumas, leapt higher from Jan. 7-13. February was up 21.0 cents to $3.213, and the balance of winter was up 13.0 cents to $2.990, Forward Look data showed. Prices for both the summer and next winter climbed less than 5.0 cents each for the period.