NGI Archives | NGI All News Access
U.S. Onshore Proppant Market Accelerating to 2015
The U.S. market for land proppant that is used to hydraulically fracturing (frack) natural gas and oil wells should grow at a rate of 8% a year for the next two years, led by the Appalachian Basin, according to PacWest Consulting Partners.
The initial findings are in PacWest’s first ProppantIQ forecast, which is predicting that the domestic market for frack proppant will increase from 63 billion pounds this year to 75 billion in 2015.
“Increasing proppant intensity is an important factor in driving market growth,” said PacWest Principal Christopher Robart. “An increase in the number of stages/well in key plays and increased proppant loading within the last year has resulted in an increase in the volume of proppant pumped in the average well. The average horizontal well increased in size from 3.3 million pounds proppant to 4.1 million pounds between the third quarter of 2012 and the second quarter of 2013. We expect this trend to continue through 2015.”
Analyst Samir Nangia, who helped to compile the report, pointed to “robust completion activity and increasing proppant intensity” as the primary market drivers.
“We expect the number of horizontal wells fracked to increase by 14% between 2012 and 2015; the total number of frack stages will increase by 15% during the same time period.”
By itself, the Appalachian market is poised for a 16% compound annual growth rate in 2013-2015, after “flat” proppant consumption between 2011-2013, said Nangia. The flat consumption rate followed the decline in natural gas prices. Those numbers already are reversing.
From 3Q2012 to 2Q2013, Appalachia’s proppant market, which consists of the Marcellus and Utica shales, rose by 53%, the most in the country. The Northeast market gains were followed by the Eagle Ford Shale (28%), Bakken Shale (26%) and Permian Basin (18%). Aggregate U.S. growth over the period was 25%, according to PacWest.
Today the proppant market continues to increase the fastest in the Marcellus/Utica, Bakken, Anadarko Basin and Eagle Ford. “Other plays have begun to show a similar increasing trend but are a smaller proportion of U.S. proppant consumption,” Nangia said.
However, proppant consumption this year compared with 2012 has fallen in several gassy plays, particularly where there isn’t a lot of dry gas drilling, notably the Haynesville Shale, down an estimated 20-30%; Fayetteville, 10-20%; Barnett, 30-40%; and in the Piceance Basin (between the Uinta and Denver-Julesburg basins) where the market for proppant is off by more than 40%.
On a play-by-play basis, three-quarters of U.S. proppant consumption by 2015 is expected to be concentrated in four areas of the country: the Appalachian plays (Marcellus/Utica), Eagle Ford, Bakken and the Permian Basin, according to PacWest. This proppant “intensity” per well is rising because operators have upped their game over the past year on three specific things:
The trend toward the higher average mass/horizontal well is expected to continue through 2015, according to PacWest.
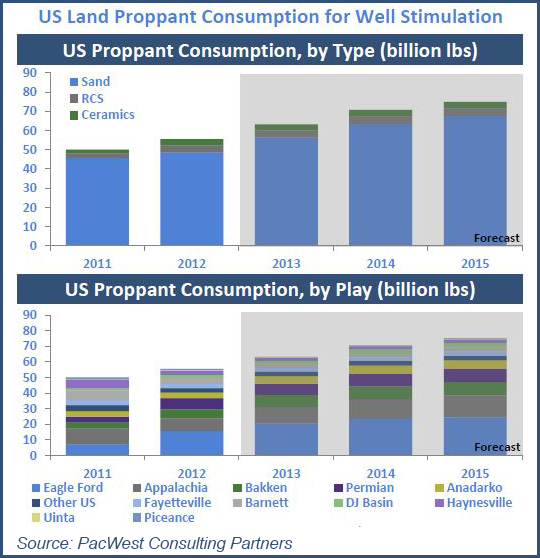
Drillers traditionally have used three types of proppants to frack wells: the “premium” resin-coated sand (RCS) and ceramics, and the cheaper raw sand. The raw sand proppant today is driving most of the growth and that should continue, according to PacWest.
The raw sand market is forecast to jump by by 9% a year from 56 million pounds in 2013 to 67 million pounds in 2015. Meanwhile, the RCS market share is forecast to increase by about 5% a year from 3.6 to 4.0 billion pounds, while ceramics should grow at a rate of about 4% to 2015, from 3.3 to 3.5 billion pounds.
Even though the premium proppants are said to increase the life of the well and reduce conductivity, it’s a no-brainer for producers. They are going with the lower-cost option.
“The ‘premium’ proppant share of the market peaked at 13% by mass in 2012 before falling to 11% in 2013,” Nangia said. The RCS and ceramics market share should continue to fall, leveling at a 10% market share by 2015.
PacWest compiled information for its quarterly report ProppantIQ using its entire database, and FracFocus.org, which included data for more than 50,000 wells and more than one million constituent records in North America.
© 2024 Natural Gas Intelligence. All rights reserved.
ISSN © 2577-9877 | ISSN © 2158-8023 |