NGI The Weekly Gas Market Report | Coronavirus | LNG | LNG Insight | Markets | NGI All News Access
U.S. Led Global Natural Gas Output, Trade in 2019, but Transition to Renewables Clear, Says BP
Global natural gas consumption climbed 2% in 2019, less than half 2018’s remarkable 5.3% increase, but its share in primary energy demand jumped to a record high of 24.2%, BP plc said Wednesday in its annual review.
Gas consumption was up by 78 billion cubic meters (Bcm) year/year in 2019, according to BP’s flagship Statistical Review of World Energy.
The London-based supermajor, the No. 1 natural gas marketer in North America, published the latest findings in its 69th annual review of energy data trends that were emerging prior to the Covid-19 pandemic.
BP produces two annual reports. The Energy Outlook, first published in 2011, provides forecasts, while the Statistical Review analyzes data from the previous year. The latest review is in the shadow of the coronavirus pandemic, with energy operators unsure whether global consumption will gain ground or permanently reverse.
CEO Bernard Looney said the transition from fossil fuels definitely became clearer last year as renewables consumption hit another record, the largest for any source of energy.
The “combined health and economic shock” from Covid-19 “is bound to reshape the global economic, political and social environment in which we all live and work,” he said. “It has the potential to accelerate emerging trends and create opportunities to shift the world onto a more sustainable path.”
In the face of the pandemic, as consumers change their lifestyles, “it feels like we are at a pivotal moment,” Looney said. “Net zero can be achieved by 2050. The zero-carbon energies and technologies exist today; the challenge is to use them at pace and scale, and I remain optimistic that we can make this happen.
For BP, “the pandemic has only reinforced our commitment to our ambition to become a net zero company by 2050 or sooner and to help the world get to net zero, by highlighting both the fragility of our planet and the opportunities it provides to truly build back better.”
Gas consumption last year was driven by the United States at 27 Bcm, followed by China with 24 Bcm, while Russia (10 Bcm) and Japan (8 Bcm) had the largest declines.
“Gas production grew by 132 Bcm (3.4%), with the U.S. accounting for almost two-thirds of this increase (85 Bcm),” economists said. “Australia (23 Bcm) and China (16 Bcm) were also key contributors to growth.”
The interregional gas trade expanded last year at a rate of 4.9%, more than double the 10-year average, pushed by a record increase in liquefied natural gas (LNG) of 54 Bcm, which was up 12.7% year/year. The gains in the gas trade came despite a 1.7% decline in pipeline trade, down by 9 Bcm, as pipeline imports into Europe from Russia and North Africa were partially crowded out by the abundance of LNG supply, BP said.
“LNG supply growth was led by the U.S. (19 Bcm) and Russia (14 Bcm), with most incremental supplies heading to Europe,” said energy economists. European LNG imports rose by 48 Bcm, a more than two-thirds increase from 2018.
Gas production growth outpaced consumption by a considerable margin last year, and storage levels responded, increasing in most regions while prices fell sharply.
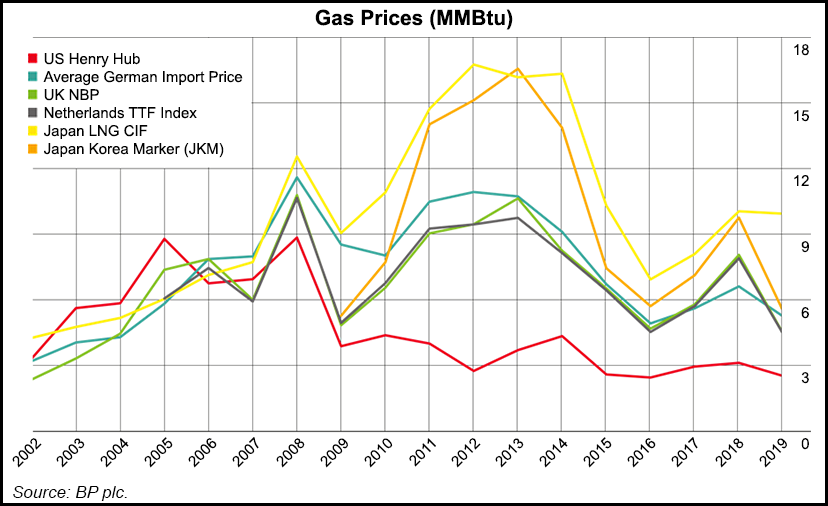
Henry Hub prices dropped almost 20% year/year to average $2.53/MMBtu, while European and Asian prices, as measured by the UK National Balancing Point (NBP) and the Japan Korea Marker (JKM), fell by more than 40%, BP said. NBP averaged $4.47 with JKM at $5.49.
“Prices in Europe, the region most affected by LNG oversupply, fell to their lowest levels since 2004,” energy economists noted.
Most of last year’s increase in production was used to feed more LNG exports, which jumped year/year by 12.7% or 54 Bcm, “the largest annual increase ever.” U.S. exports led the way, up 19 Bcm from 2018, followed by Russia at 14 Bcm and Australia, with exports rising by 13 Bcm.
“On the LNG import side, nearly all incremental supplies headed to Europe, in contrast to 2018 when Asia drove import growth,” according to the BP team. “European LNG imports rose by 49 Bcm, representing an unprecedented 68% increase. Growth was widespread, with the UK (11 Bcm), France (10 Bcm) and Spain (7 Bcm) the largest individual contributors.”
Led by strong U.S. growth, which accounted for almost two-thirds of the net global total, gas production grew by 132 Bcm (3.4%) last year. The U.S. volumetric increase of 85 Bcm was slightly under the 2018 record of 90 Bcm. Supply also was lifted by strong growth in Australia (23 Bcm) and China (16 Bcm).
Meanwhile, global proved reserves increased from 2018 by 1.7 Tcm to 198.8 Tcm. China (2 Tcm) and Azerbaijan (0.7 Tcm) provided the largest growth, partially offset by a 1.3 Tcm decline in Indonesian reserves. Russia (38 Tcm), Iran (32 Tcm) and Qatar (24.7 Tcm) are the countries with the largest reserves, according to BP.
Global natural gas consumption also grew from 2018, averaging 2% higher, but it was below the 10-year average and down sharply from the exceptional growth seen in 2018 (5.3%). “In volume terms, demand grew by 78 Bcm, led by the U.S. (27 Bcm) and China (24 Bcm),” energy economists said.
U.S. and Chinese gas consumption also slowed last year from 2018, as weather effects and the policy to drive coal-to-gas switching in China faded. A decline in the number of unusually hot and cold days also contributed to a decrease in Russia’s gas consumption to 10 Bcm, the largest decline of any country last year, according to BP.
Oil consumption in 2019 grew year/year by a below-average 0.9 million b/d, or 0.9%, according to BP. Demand for all liquid fuels (including biofuels) rose by 1.1 million b/d and topped 100 million b/d for the first time.
Oil consumption growth was led by China (680,000 b/d) and other emerging economies, while demand fell in developed economies, i.e. the Organisation for Economic Co-operation and Development, or OECD (down by 290,000 b/d).
“Global oil production fell by 60,000 b/d as strong growth in U.S. output (1.7 million b/d) was more than offset” by a 2 million b/d decline in production the Organization of the Petroleum Exporting Countries, including Venezuela (down by 560,000 b/d) and Saudi Arabia (down by 430,000 b/d).
Well before the pandemic, primary energy consumption last year was slowing, down 1.3% year/year, or less than half the 2018 growth rate of 2.8%, the BP team reported. Carbon emissions from energy use climbed by 0.5%, partially unwinding the 2.1% growth in 2018, with the average annual increase in carbon emissions over 2018 and 2019 above the 10-year average.
“Renewables contributed their largest increase in energy terms on record” at 3.2 exajoules, and accounted for more than 40% of the global growth in primary energy last year, more than any other fuel, energy economists noted. The renewables share in power generation (10.4%) also topped nuclear for the first time.
Meanwhile, coal’s share in the energy mix declined in 2019 to 27%, its lowest level in 16 years as consumption fell by 0.6%. Still, coal remained the single largest source in global power generation, accounting for more than 36% of consumption.
BP noted that electricity generation increased by only 1.3% from 2018, around half its 10-year average, with China accounting for more than 90% of net global growth.
“Renewables provided the largest increment to power generation, followed by natural gas while coal generation fell,” energy economists said. “The share of renewables in power generation increased from 9.3% to 10.4%, surpassing nuclear for the first time. Coal’s share of generation fell 1.5 percentage points to 36.4% — the lowest in our data set,” which started in 1985.
© 2024 Natural Gas Intelligence. All rights reserved.
ISSN © 1532-1231 | ISSN © 2577-9877 | ISSN © 1532-1266 |