E&P | NGI All News Access | NGI The Weekly Gas Market Report
U.S. E&Ps Spending Less, Producing More Natural Gas, Oil
U.S. natural gas and oil reserves each increased by 9% in 2013 at a lower cost than in 2012, primarily because of gains by the largest independents, Ernst & Young LLP (EY) revealed in its latest annual review.
Domestic exploration and production (E&P) operators are “emerging from years of volatility prompted by the global financial crisis and subsequent recession,” which when combined with ever better technology allowed the twin gains in reserves. Those reserves increases came despite a 7% decline in capital spending from 2012.
The study is an analysis of reserves disclosure information reported to the U.S. Securities and Exchange Commission. Upstream results for the five-year period from 2009 through 2013 were reviewed for the largest 50 companies, based on 2013 end-of-year reserve estimates, which generally are representative of the domestic E&P industry as a whole.
“The promising oil and natural gas reserves, and profit increases, are certainly signs that the industry is enjoying more stability than it has in recent years,” said EY’s U.S. Oil & Gas Leader Deborah Byers. “While we saw lower capital expenditure numbers in 2013, that is due in part to the advancement in technologies and processes that are making exploration and production less expensive and more efficient.”
EY split the E&Ps into three peer groups: integrateds, large independents and independents. Any way it’s sliced, the large independents contributed to the biggest absolute increases in natural gas reserves and in oil reserves.
The large independents contributed to a 15% increase in end-of-year gas reserves from 2012 to 11.1 Tcf, while the independents were up 11%, or 4.9 Tcf. The integrateds, which include ExxonMobil Corp., Chevron Corp. and BP plc, had a 1.2 Tcf decline in gas reserves, off 3% from 2012.
The usual top U.S. gas producers also were the leaders in 2013, led by ExxonMobil (26.30 Tcf), Chesapeake Energy Corp. (11.73 Tcf), BP (9.95 Tcf), ConocoPhillips (9.58 Tcf) and Anadarko Petroleum Corp. (9.21 Tcf). ConocoPhillips no longer is an integrated, but it was included as such in the reserves ranking.
“Large independents accounted for the largest absolute increases in oil and gas reserves in 2013, though the gas reserves still remain below the level we saw in 2011,” Byers said.
Oil reserves among the large independents also led the list, up 13% from 2012 to 1.3 billion bbl. The medium independents’ reserves rose 14% to 771.6 million bbl. The integrateds reserves were flat.
The leading oil reserves holdings also were led by ExxonMobil (2.31 billion bbl), followed by ConocoPhillips (2.29 billion bbl), BP (2.20 billion bbl), Occidental Petroleum Corp. (1.94 billion bbl) and Chevron (1.33 billion bbl).
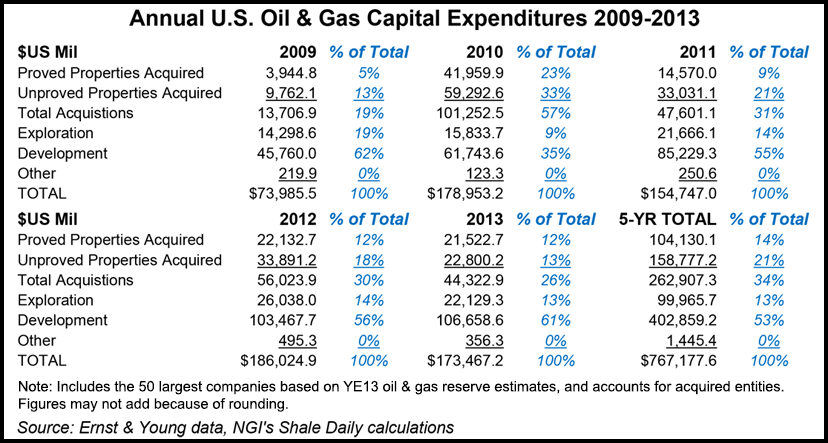
Compared with 2012, total capital expenditures declined 7% to $173.5 billion, driven by lower costs for unproved property acquisitions and exploration. Proved reserve acquisition costs, however, rose 57% to $16.88/boe from $10.76, as most transactions were centered around oil reserves.
Over the five-year period, EY found that growth through acquisitions has been around 40% more economical than finding and development (F&D) additions, with proved reserve acquisition costs averaging $11.28/boe, versus $19.44 for F&D.
“While exploration costs declined approximately 15% in 2013, the level of spending represented the second highest amount of the five-year study period,” the study found. “Development spending increased every year of the five-year study period and reached $106.7 billion in 2013.
All three peer groups in 2013 had an increase in F&D spending, but all three also spent less on exploration.
“Exploration costs were $22.1 billion in 2013, compared to $26 billion in 2012, a 15% decrease,” EY said. “Despite this decline, the 2013 level of spending represented the second-highest amount of the five-year study period.”
End-of-year oil reserves have increased in each year of the past five years, reaching 25.4 billion bbl in 2013. After decreasing in 2012 because of downward reserve revisions related to depressed gas prices, end-of-year gas reserves rose to 178.7 Tcf in 2013. Even with better pricing, gas production dipped slightly for the first time in the study’s five-year period.
However, extensions and discoveries for both oil and gas reserves in 2013 were the highest of the five-year study period. Additions for oil reserves encompassed 4.1 billion bbl in 2013 and contributed to an oil production replacement rate of 222%, excluding purchases and sales. Extensions and discoveries of 29.9 Tcf were reported for gas reserves in 2013, and the production replacement rate was 229%, excluding purchases and sales.
© 2024 Natural Gas Intelligence. All rights reserved.
ISSN © 2577-9877 | ISSN © 1532-1266 | ISSN © 2158-8023 |