For the three trading days ended Oct. 30 physical gas prices fell an average of 12 cents to $3.62, according to NGI’s National Spot Gas Average.
NGI Data
Articles from NGI Data
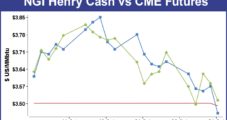
Firm Marcellus Unable to Offset Weak East, Northeast; Futures Slide
Physical gas prices for Friday delivery tumbled an average 9 cents Thursday as traders were eager to get deals done ahead of weekly government inventory statistics.
October 31, 2013
New England Leads Quotes Lower; Futures Ease Slightly
Natural gas for physical delivery Thursday eased 2 cents overall on average in Wednesday’s trading, with New England points leading the charge lower with double-digit losses, while Marcellus points gained ground. For the most part, losers outnumbered winners, but most locations managed to trade within a few cents of unchanged.
October 30, 2013
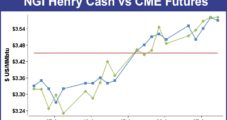
Weak Northeast, East Lead Market Lower; November Out Like A Lamb
Physical gas prices for Wednesday delivery fell 6 cents overall in Tuesday’s trading, while traders were busy keeping one eye on a slip-sliding November futures contract as well as weather forecasts calling for unseasonable warmth in eastern energy markets and a weak next-day power market.
October 29, 2013
Big New England Gains Can’t Offset Wider Weakness; Futures Flop
Natural gas prices for physical delivery Tuesday declined on average 4 cents overall in Monday’s trading. Losses were widespread, but weather driven strength in New England was able to offset pervasive declines elsewhere. East, Rockies and California locations all fell anywhere from a few pennies to close to a dime.
October 28, 2013
East Weakness Offsets Broader Strength; Analysts See Case for Higher Winter Prices
Physical natural gas prices for weekend and Monday delivery added a penny on average Friday. Prices generally moved within a nickel of unchanged at most points, but Northeast and Eastern seaboard locations found themselves mostly in the loss column.
October 25, 2013
Surging Northeast Leads Mixed Weekly Action
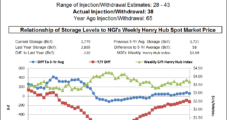
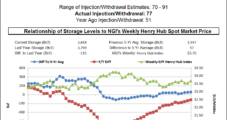
On average weekly prices regionally were all over the map, but the national average came in at $3.74, unchanged from a week ago. South Texas saw the week’s biggest losses, dropping a stout 12 cents to $3.61, and the Northeast reveled in the week’s greatest gains, adding 26 cents to $3.66. Of individual market points, Transco Leidy enjoyed the greatest gain, adding $1.13 to $2.84, and two Texas Eastern points suffered the week’s greatest losses, dropping 13 cents at both Texas Eastern S TX ($3.59) and Texas Eastern W LA ($3.60).
October 25, 2013
Weak New England Leads Far-Reaching Decline; Futures Recover Early Losses
Physical natural gas for Friday delivery overall declined 4 cents as most traders elected to get their deals done prior to the release of often volatility-inducing storage figures.
October 24, 2013
Cold Has Midwest Buyers Scrambling; Futures Inch Higher
Wednesday physical natural gas trading for Thursday delivery saw widespread weakness of a few pennies at most spots around the country offset by significant strength in California and New England, where colder temperatures were beginning to set in.
October 23, 2013
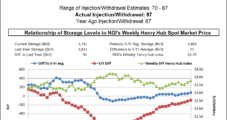
Gulf Leads Broad Decline; Expected Storage Build Derails Futures
Physical natural gas prices for Wednesday delivery on average overall fell a nickel in Tuesday’s trading. Most major market centers were well into the red, and Gulf Coast points were on the losing side of the trading ledger as well.
October 22, 2013
Listen to the latest episode of our newest podcast NGI's Hub and Flow via: