Markets | Infrastructure | LNG | NGI All News Access | NGI The Weekly Gas Market Report
Sweltering Heat Sparks Surge for Natural Gas Forward Prices
Intensifying heat across the United States led a sharp rally for natural gas forward prices at a time when exports remain slow and uncertainty continues over energy demand recovery amid the coronavirus pandemic. Prices for August natural gas jumped 15.0 cents on average during the July 2-8 period, as did the balance of summer (August-October), according to NGI’s Forward Look.
The back of the curve also increased, but gains were far more muted as a persistent rise in Covid-19 cases stands to threaten demand recovery this winter and beyond. Prices for both the winter 2020-2021 (November-March) and summer 2021 (April-October) were up only 2.0 cents on average, Forward Look data show.
The double-digit gains for the remaining months of summer were similar to those seen in Nymex futures, which in recent weeks had plunged to multi-decade lows amid the overwhelming bearishness in the market until now. After sinking below $1.50/MMBtu last month, the prompt-month Nymex contract sat Wednesday at $1.824.
“While the surge in cooling demand would spur increases in natural gas prices even in normal times, concerns with end-of-season storage levels have amplified the move up,” said EBW Analytics Group.
Indeed, after a mild winter left storage inventories well ahead of historical levels at the start of spring, Covid-19 made the oversupply situation even worse as it decimated what little demand there was remaining. What followed over the next couple of months was a barrage of hefty storage injections that elevated stocks to more than 700 Bcf above year-ago levels and nearly 500 Bcf above the five-year average.
However, with heat building across the Lower 48, storage injections appear to be thinning. On Thursday, the U.S. Energy Information Administration (EIA) reported a 56 Bcf injection for the week ending July 3, the second week in a row in which the agency reported a sub-100 Bcf figure.
The build was in line with expectations that ranged from a 51 Bcf build to a 66 Bcf build, but it came in well under last year’s 83 Bcf injection for the similar week as well as the 68 Bcf five-year average, according to EIA.
“Balance wise, this is a strong number, in our view, in terms of what is needed to avoid containment,” but the market needs to sustain a strong weather pattern to continue offsetting the impact of very low liquefied natural gas (LNG) volumes, “which are likely here to stay for awhile yet,” Bespoke Weather Services said.
With projections of a record number of gas-weighted degree days (GWDD) already, forecasts moved even hotter Thursday, a change that was reflected in both the American and European models. The hotter outlook was seen after the middle of the month, as guidance depicts a massive upper level ridge taking shape over much of the nation, according to Bespoke. The only regions escaping the heat were the West and Southeast, both of which are closer to normal.
“Odds continue to increase that we will rack up enough GWDDs to set the record for the hottest July in our dataset, based on total GWDDs, beating out 2011, even if the current 15-day is a little too hot in the modeling,” the firm said. “With the La Niña base state firmly entrenched, above-normal heat is likely to last into the end of the month and into August.”
Nevertheless, near-term strength could relapse later this summer if underlying core fundamentals remain weak, according to EBW.
As of the evening cycle for Thursday’s gas day, LNG feed gas demand from interstate pipelines had fallen to 2.8 Bcf/d, nearly 1.1 Bcf/d less than June’s average. Since July 1, feed gas demand has remained relatively steady near 3.0 Bcf/d.
However, Thursday’s declines come as demand from Cameron LNG facilities have fallen by an additional 95 MMcf/d, according to Genscape Inc. But the firm’s analysts also have noted that Sabine Pass Train 3 turned on all of its liquefaction engines while Trains 1 and 5 have remained partially online; trains 2 and 4 are completely offline.
“The uptick in liquefaction operations at Sabine Pass LNG has yet to result in a noticeable increase in feed gas deliveries,” Genscape said. Nominations for feed gas deliveries to Sabine Pass LNG are posted at 1.11 Bcf/d, suggesting a day/day decline of 25 MMcf/d.
At the same time that LNG demand has weakened, production appears to be edging higher. EBW said the seven-day moving average for natural gas production has increased by 0.35 Bcf/d. However, the firm noted that output may be lower through Sunday due to unscheduled maintenance on Columbia Gas Transmission.
“Production’s tick higher may subside as natural well declines and lack of investment in production growth begin to come to the forefront,” EBW said. “Recent production levels have been muddied by producers bringing back shuttered oil production from late spring and curtailed natural gas, offsetting natural declines.”
It appears that the stock of shuttered production waiting to be brought online may be largely depleted by early August, according to EBW, leading to existing well declines rapidly outpacing new production coming online. Falling production would help support natural gas, the firm said, but it is not clear the resumption of the likely trend toward lower production will become evident to the market by early- to mid-August.
Furthermore, there is an element of uncertainty that the current increase in coronavirus cases is foreshadowing a coming calamitous spike in the death rate or is an artifact of increased testing. “If the former, a renewed wave of strict lockdowns in Florida, Texas and California cannot be entirely ruled out, with the associated reduction in demand likely weighing on natural gas again by late summer,” EBW said.
Trailing Permian
With incremental volumes from the Permian Basin re-entering the market as producers begin to return previously curtailed production, forward price gains in the region fell short of other markets across the country.
Waha prices for August climbed 9.0 cents between July 2 and 8 to reach $1.467, Forward Look data show. The balance of summer was up 11.0 cents to $1.390, while the winter 2020-2021 strip and prices for next summer rose less than a nickel week/week to average $2.180 and $1.930, respectively.
Prices out West also lagged other markets across the Lower 48 amid a mixed outlook for hydropower for the rest of this summer. The EIA said this week that seasonal precipitation to date in the northern half of the Columbia River Basin in the Pacific Northwest is approaching near-normal levels following strong storms at the beginning of the year.
Conversely, the southern half of the Columbia River Basin is experiencing below-normal seasonal precipitation levels, and most of the reporting stations in Oregon were lower than 70% of normal, according to EIA. These differences in seasonal precipitation are reflected in the regional differences in the water supply forecast for April through September.
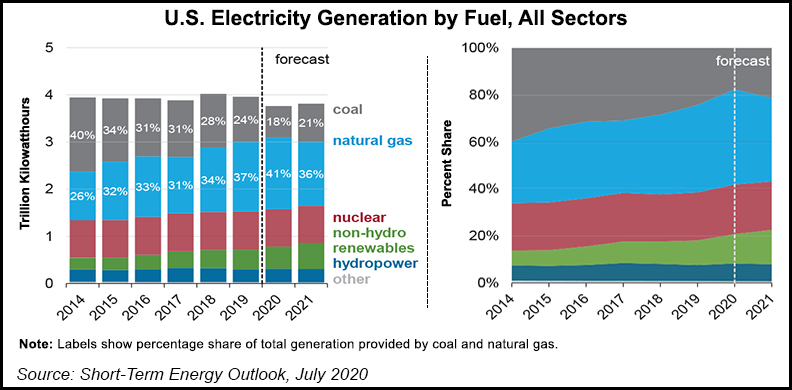
As of June 4, the Northwest River Forecast Center projected the Dalles Dam water supply forecast for April through September to be roughly 8% higher than the 30-year normal. In its July STEO, the EIA forecasts that hydroelectric generators would provide 285 million megawatt hours in 2020. About half of that total is to come from hydro plants in the Northwest and overall, hydroelectricity is expected to account for 8% of U.S. electricity generation in 2020.
Given the optimistic outlook for hydroelectric generation this summer and some cooler weather forecast for the Northwest over the coming days, Northwest Sumas prices rose 9.0 cents from July 2-8 to reach $2.517, according to Forward Look. The balance of summer also picked up 9.0 cents to average $2.560, while prices for the winter were down 7.0 cents to $3.750.
California price gains also trailed the rest of the country, with PG&E Citygate’s August and balance-of-summer contracts tacking on only 3.0 cents apiece to $2.501 and $2.510. Like prices farther upstream in the Pacific Northwest, winter strip pricing moved lower on the week, sliding 9.0 cents to $3.210. Summer 2021 was down 5.0 cents to $3.10.
© 2024 Natural Gas Intelligence. All rights reserved.
ISSN © 2577-9915 | ISSN © 2577-9877 | ISSN © 1532-1266 |