Storage Overhang Pressures NatGas Forwards Despite Record Heat
Natural gas forwards markets slid an average of 7 cents between July 8 and 14 as potentially record-setting heat was no match for bloated storage inventories, according to NGI’s Forward Look.
This week’s downturn is the second consecutive week prices have fallen in the face of extreme heat, a sign that even as scorching temperatures have led to record power burn, high storage inventories are causing concern in the market regarding congestion come fall.
“As of the week ending July 8, natural gas storage stood at 3,243 Bcf, or +100 versus prior record levels for the corresponding week. The prior eight weeks had demonstrated a surplus versus prior seasonal highs of 60-80 Bcf, and today’s report marked the first time since early March that this metric had reached triple digits,” said analysts at Mobius Risk Group.
The growth in the surplus means the remainder of the injection season will be even more critical for the market, as the next nine weekly reports will need to be comfortably below 40 Bcf in order to have a reasonable chance of reaching the end of October with less than 4 Tcf in storage, Mobius said.
Since July 1, the national price for August has fallen 28 cents, Forward Look data shows.
The Nymex August contract has dropped 25.8 cents since that time.
One reason for the rapid decline in gas prices can be attributed to the return of most of the nuclear generation that had been offline in recent weeks for maintenance, planned or otherwise.
More than 95% of U.S. nuclear generation was up and running Friday.
Another reason for the slide could be that prices increased too much, too quickly heading into the key summer power demand season, making gas less competitive versus coal, according to NGI’s Pat Rau, director of strategy and research.
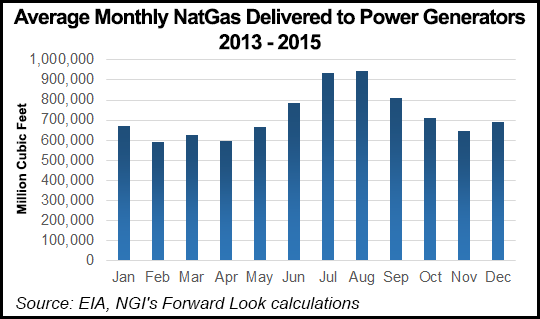
“July and August are the two biggest months in terms of gas burn by power generators. If gas is now less competitive versus coal, then more gas during these two key summer months could be diverted into storage, rather than delivered to power plants. That would be negative on prices, all things being equal,” Rau said.
Data from the U.S. Energy Information Administration and NGI shows gas delivered to U.S. power generators between 2013 and 2015 averaging just below 800,000 Mcf/d in June, but then peaking above 900,000 Mcf/d for both July and August before sliding back to around 800,000 Mcf/d for September.
The two-week slide comes as a majority of weather data shows hot and humid conditions over the central and southern U.S. going forward, including a large portion of the Midwest, where heat indexes are expected to reach 100-112 degrees F, according to forecasters at NatGasWeather.
Although the most recent models turned slightly more bearish, high temperatures in the 90s and 100s will be widespread over much of the country, the forecaster said.
“The next period of focus is on late July and whether the hot upper ridge will shift over the west-central U.S. due to minor cooling over the East Coast. The alternative is it remains quite hot over much of the country, with much stronger than normal nat gas demand besides the far northwest and northeast corners,” NatGasWeather said.
But as prices have failed to break above $2.76, and have failed to bounce back significantly following Monday’s nearly 10-cent sell-off, it appears there is more selling pressure to the downside, Bespoke Weather Services said.
“The result is that weather again may be taking a back seat as much of this heat has been factored in around these prices, though bearish long-range risk could accelerate selling next week if it began to move into the medium range,” Bespoke said.
It is also important to note that weather forecasts now extend beyond July 22, which is the hottest day of the year based on normal historical temperatures, Mobius said.
“In other words, from July 22 on, demand will steadily decrease based on normal weather,” Mobius said.
And while weather so far this summer has been consistently bullish, a mild weak in late August or early September can quickly dampen the bullish case made by market participants in June, analysts said.
“There is still plenty of summer weather remaining, and we would expect increased price volatility around each weather update and each weekly storage report,” Mobius said.
Indeed, Friday trading brought about some increased volatility as prices slid as much as around five cents lower than Thursday’s settle, but then bounced back to trade a couple of cents higher on the day.
“We thought today’s price action would be quite telling on whether the nat gas markets were concerned about upcoming heat, which they didn’t seem to be all week, but maybe now appears to have been bluffing,” NatGasWeather said. “Either that, or nervous hands going into the close took or exited positions, forcing shorts to quickly take profits.”
Taking a closer look at individual gas markets across the country, Northeast markets posted more substantial decreases across their forward curves, Forward Look data shows.
At New England’s Algonquin Gas Transmission citygates, August prices fell 22 cents between July 8 and 14 to reach $2.857, a more than 20-cent discount to gas priced for July 15 delivery.
The steep declines were seen across the curve. AGT September was down 26 cents between July 8 and 14, while the balance of summer (September-October) was down about 25.5 cents, according to Forward Look.
AGT’s winter strips also put up double-digit decreases as the prompt winter tumbled 24 cents and the winter 2017-2018 slid 13 cents.
Other Northeast points’ losses were less dramatic but still quite a bit more than other markets.
At Transco zone 6-New York, August dropped 13 cents from July 8 to 13 to reach $2.13, compared to the 7-cent national average and 45 cents below the spot gas price for July 15 delivery.
NY September fell 13 cents, compared to the national average of 8 cents; the balance of summer slipped about 12 cents, compared to the national average of 8 cents; and the prompt winter plunged a far greater 28 cents, compared to the national average of just 6 cents, Forward Look data shows.
Even the winter 2017-2018 strip dropped 23 cents, well above the national average decline of 2 cents.
The hefty losses this week for the Northeast could be a correction as prices in that region did not experience the dramatic declines the rest of the country did during the week of July 1-7, according to Forward Look.
© 2024 Natural Gas Intelligence. All rights reserved.
ISSN © 2577-9915 | ISSN © 2577-9877 |