Rare Summer Storage Draw Falls on Deaf Ears; NatGas Forwards Prices Dip
In a week that brought about a historically bullish natural gas storage report, forwards markets surprisingly shrugged off the news, sliding by an average 4.1 cents between July 29 and Aug. 3, according to NGI Forward Look.
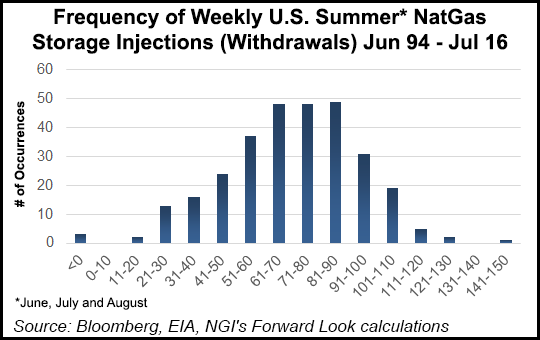
The U.S. Energy Information Administration reported a 6 Bcf withdrawal for the week ending July 29, which NGI calculations found was only the third time since 1994 that the U.S. has experienced a weekly withdrawal during the June, July, and August summer months. The other two occasions were both in 2006: a 7 Bcf withdrawal for the week ended July 21, and a 12 Bcf withdrawal for the week ended Aug. 4.
While the withdrawal trimmed the storage surplus versus the five-year average by some 60 Bcf, market players appeared largely unimpressed as the Nymex essentially stalled out the day the EIA released its report, slipping just five-tenths of a penny.
“After an initial spike to $2.87, the front contract fell, either because the market judged this number not tight enough or it was already factored in,” NatGasWeather, a weather forecaster focused on natural gas demand, said.
NGI’s Patrick Rau, director of strategy and research, agreed, saying weekly injections had been declining the previous few weeks, and the low end of the weekly estimates was in fact -6 Bcf, so the storage withdrawal was not really that much of a surprise.
The Nymex September contract was on track to shed even more weight in Friday trading, slipping around 6 cents by mid-day.
The prompt-month contract dropped 4.3 cents between July 29 and Aug. 3.
The team at Bespoke Weather Services sees additional downside heading into next week, with tests of $2.76 and $2.72 likely as the market looks ahead to growing injections for the remainder of the summer and into the fall.
“We see the first technical support at $2.76, the 30-day moving average for the September contract that we have been bouncing around, but that opens up more than another percent of downside through the day unless we can catch a bottom,” Bespoke said Friday.
Interestingly, if the September contract ends Friday in the red, it would be the first time since late June, as typically, prices have rallied into the weekend and then declined early the following week, Bespoke said.
The additional downside risk comes even as weather forecasts remain largely supportive in the near term.
“Overnight scrapes were marginally tighter as the bullish EIA data weighed on expectations for next week, both of which should prove mildly supportive,” Bespoke said.
Indeed, the latest weather models continue to show a very warm to hot weather pattern across much of the U.S. going into the second half of August, but still with modest swings in natural gas demand every several days, from slightly above normal to much above normal, according to NatGasWeather.
It will be most uncomfortable over the east-central and southern U.S. the next few days, where hot temperatures will combine with high humidities to push the heat index to 100-105+ degrees F, focused across eastern Texas and the Mississippi River Valley, the forecaster said.
The Mid-Atlantic and Northeast will also see unusually high temperatures in the upper 80s and low 90s, but will cool off late in the weekend as Canadian air spills into the Northeast, easing overall national natural gas demand slightly.
“The next opportunity for cooler air to ease natural gas demand to more seasonal levels will be around or after Aug. 16,” NatGasWeather said.
Until then, the heat and humidity should result in much smaller-than-normal storage builds for several more weeks to come, allowing surpluses in supplies to continue their steady decline, it said.
Indeed, Genscape shows end-of-season storage inventories may come in under 3.9 Tcf.
Genscape, based in Louisville, KY, is a real-time data and intelligence provider of energy and commodity markets.
Last year, stocks reached a record 3,953 Bcf at the end of October.
Taking a closer look at the forwards markets, the bearish trend for September extended into the remainder of the year.
The Nymex October contract fell 4 cents between July 29 and Aug. 4 to reach $2.88, while the prompt winter dropped 4.8 cents to $3.28.
Summer 2017 prices were unchanged during that time, holding steady at $3.08.
“Producers are stepping up production a little bit during the second half of 2016, and that may be contributing to some of the ROY16 selloff,” Rau said.
“But those production increases won’t be all that material, so that by itself shouldn’t cause prices to fall too far, too quickly. Could be some technical-based selloffs going on here, too,” he added.
But NGI’s Nate Harrison, markets analyst, said it appears the market may be in some sort of denial phase with regard to pricing.
“We’ve got some major trends pointing to higher prices,” Harrison said.
For starters, storage didn’t end up filling to the brim, but instead started drawing early.
Even if this week’s reported draw is not likely to be the start of an immediate trend, there are some regions where storage pulls have been prevalent.
“South Central has been drawing for a while,” Harrison said.
Indeed, EIA historical data shows the South Central region posting withdrawals for the past three weeks and in five of the last six weeks.
Meanwhile, Mexico is importing almost 1 Bcf of every 20 Bcf that the U.S. produces, a figure that is increasing pretty quickly, he said.
In addition, natural gas production has been in decline since February, and most of U.S. capex is being sent into the Permian and Eagle Ford, which are oil plays, Harrison said.
“The forward and futures curves may not be fully pricing in long-term upside since liquidity is lower out the curve,” Harrison said. “This is masked a bit by major providers of these data “smoothing” (filling in holes) where a contract didn’t trade.”
And while most markets followed the general downtrend, some points in the Northeast continued to put up steeper losses.
In fact, the declines were seen not only for the remainder of the year, but through 2017 and into 2018, Forward Look data shows.
At Dominion South, September prices tumbled 11.2 cents between July 29 and Aug. 3 to reach $1.27, while October plunged 10.2 cents to $1.35.
Seasonal packages put up solid losses as well. Dominion’s prompt winter strip dropped 10.4 cents from July 29-Aug. 3 to reach $2.16, summer 2017 lost 8 cents to hit $2.02 and the winter 2017-2018 fell 4 cents to $2.53, according to Forward Look.
Dominion’s weakness comes as production in the region remains on an upward trajectory through 2017, according to Genscape.
In fact, Dominion Transmission (DTI) on Aug. 1 added 10 new production meters to its operationally available capacity report.
Collectively, these meters have 25.1 MMcf/d in operational capacity, Genscape said.
The largest meter, Michaels (GX4048) has a capacity of 20 MMcf/d, resides in West Virginia, and is operated by Abarta Oil & Gas Co.
There are not any firm transportation contracts that involve these meters, as reported by DTI, Genscape said.
Production on DTI’s system this summer has fallen short of 2015 by 395 MMcf/d. Last Friday saw a record low of 1,418 MMcf/d. Since then, however, Genscape has seen production on DTI rise to 1,769 MMcf/d on Aug. 1.
“With Spring Rock’s latest forecast release, the East stands as the only region in the Lower 48 where summer and/or winter-over-winter growth is expected. All other regions are in decline and, collectively, at a rate that is finally overwhelming the East growth,” Genscape said.
© 2024 Natural Gas Intelligence. All rights reserved.
ISSN © 1532-1231 | ISSN © 2577-9877 |