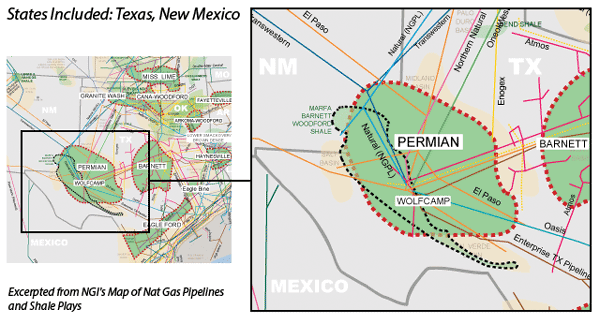
Background Information about the Permian Shale Basin
The venerable Permian Basin’s liquid gold has attracted oil and natural gas prospectors for decades. The energy bounty hiding beneath the sparse lands encompassing nearly all of West Texas and a portion of southeastern New Mexico might be nonexistent to casual travelers passing through. But don’t let the dearth of people fool you. Traffic is fairly constant on the two-lane paved roads, as pick-up trucks ferry workers and 18-wheelers carry supplies to the drilling sites that sit behind high metal fence.
Mule deer and javalinas share their land with the oil rigs and the man camps that dot the landscape. A sulfury smell often permeates the air, along with the dust that clings to jeans and boots. “Y’all smell that? It’s the smell of money,” West Texans will tell you.
The Permian’s energy riches cover an area about 250 miles wide and 300 miles long, a whopping 75,000 square miles, with oil and gas produced from depths of a few hundred feet to miles below the surface. The basin contains one of the world’s thickest deposits of Permian-aged rocks from an era 299 million to 251 million years ago, when the basin reached its maximum depth of 29,000 feet.
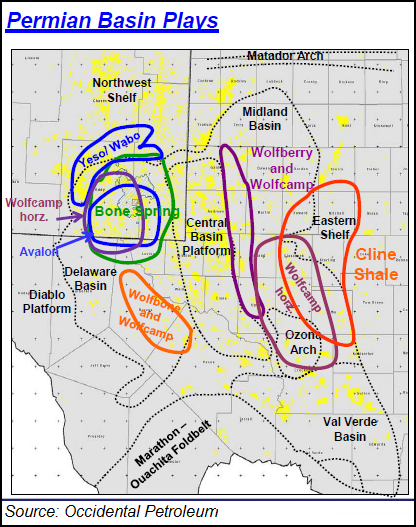
And that thickness is what separates the Permian from everything else. In terms of the thickness of the hydrocarbon producing zone, the Bakken Shale averages 10-120 feet in thickness, while Eagle Ford Shale formations are 150-300 feet thick. The Permian offers formations that are 1,300-1,800 feet, which is 12 times the Bakken thickness. Within the Permian are three large sub-basins stacked with various reservoirs of limestone, sandstone and shale. The Midland and the Delaware, the two big targets for producers today, are separated by the Central Basin Platform (CBP). Other sections of the Permian include the Northwest Shelf, Marfa Basin, Ozona Arch, Hovey Channel, Val Verde Basin and Eastern Shelf.
Today producers mostly are dropping their drillbits into the Midland and the Delaware zones. The Midland’s multi-layer zones are highlighted by the Spraberry and Wolfcamp formations, while the Delaware, about 2,000 feet deeper, also features the Wolfcamp Shale, as well as the frequently targeted Bone Spring Sand and Avalon formations.
Noticeably absent from the recent surge in drilling is the CBP, which features more conventional formations, as well as enhanced oil recovery operations using waterfloods and carbon dioxide. However, that is not to say that the CBP does not play a major role in the Permian. The CBP in Andrews, Ector, and Gaines counties, TX, is one of the most prolific crude producing areas in the Permian. The Wolfcamp Shale underlies the CBP, so there also is some potential unconventional upside in this area as well.
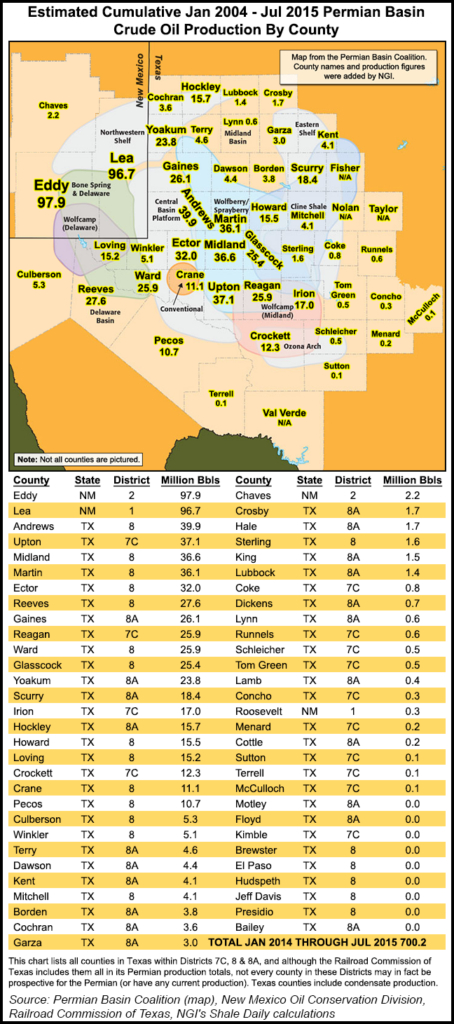
Six formations provided about 60% of the increase in Permian production between 2007 and 2014, according to the U.S. Energy Information Administration. In no particular order, they were Bone Spring, Delaware, Glorieta, Spraberry, Wolfcamp and Yeso. We highlight all the major focus areas in the Permian in the table below, followed by maps that show the various sub-basins in the Permian and a breakout of Permian crude oil production by county since 2014.
| Resource Play | Type/Primary Target | Location |
| Abo Formation | Tight Sands – Oil | NM, W. TX |
| Avalon Shale | Shale – Gas | NM, W. TX |
| Bone Springs (2nd & 3rd) | Tight Sands – Oil | NM, W. TX |
| Cline Shale | Shale – Oil | W. TX |
| Penn Shale | Shale – Oil | W. TX |
| Spraberry | Tight Sands – Oil | W. TX |
| Wolfberry | Shale/Tight Sands – Oil | W. TX |
| Wolfbone | Shale/Tight Sands – Oil | W. TX |
| Wolfcamp Shale | Shale – Oil | NM, W. TX |
| Yeso Formation | Carbonate – Oil | NM |
The Permian has been reliably pumping oil and gas since the 1920s, but horizontal drilling and hydraulic fracturing in oil reservoirs has led to a boom that began about 2012. In 2008, oil production was about 710,480 b/d in the Texas portion. Between January 2007 and August 2015, crude oil production in the Permian grew from 843,000 b/d to 1,961,000 b/d, an annualized trend-line growth rate of 10.6% per year. Not bad for a “mature” play that first began producing more than 90 years ago.

Even as crude oil prices declined in the last half of 2014 and through 2015, the Permian continued to be one of the only places in the United States where oil production kept rising (see Shale Daily, Nov. 9, 2015). Natural gas production also has risen steadily. Between 2008 and 2014, gas production in the Texas side of the Permian climbed from 3,529 MMcf/d to 4,201 MMcf/d. Between January and September 2015, the region was one of the few areas where gas production still was rising to an average of 4,636 MMcf/d. In June 2015, RBN Energy estimated the rate of return in the Delaware Basin to be as much as 27%, making it one of the highest return plays in the United States at the time.
Deal making across the United States fell through 2015, but the Permian still accounted for the biggest and the most. During the third quarter, the Permian was the most active onshore play for deals, with seven worth $4.1 billion (see Daily GPI, Oct. 28, 2015). And while the Permian only accounted for only one deal during 2Q2015 that was worth more than $50 million, it was the highest valued transaction in all onshore plays at $3.9 billion: Noble Energy Inc.’s acquisition of Rosetta Resources Inc. (see Shale Daily,May 11, 2015). Chinese investment firm Yantai Xinchao Industry Co. Ltd. in October 2015 also agreed to pay $1.31 billion to purchase property in the West Texas counties of Borden and Howard (see Shale Daily, Oct. 26, 2015).
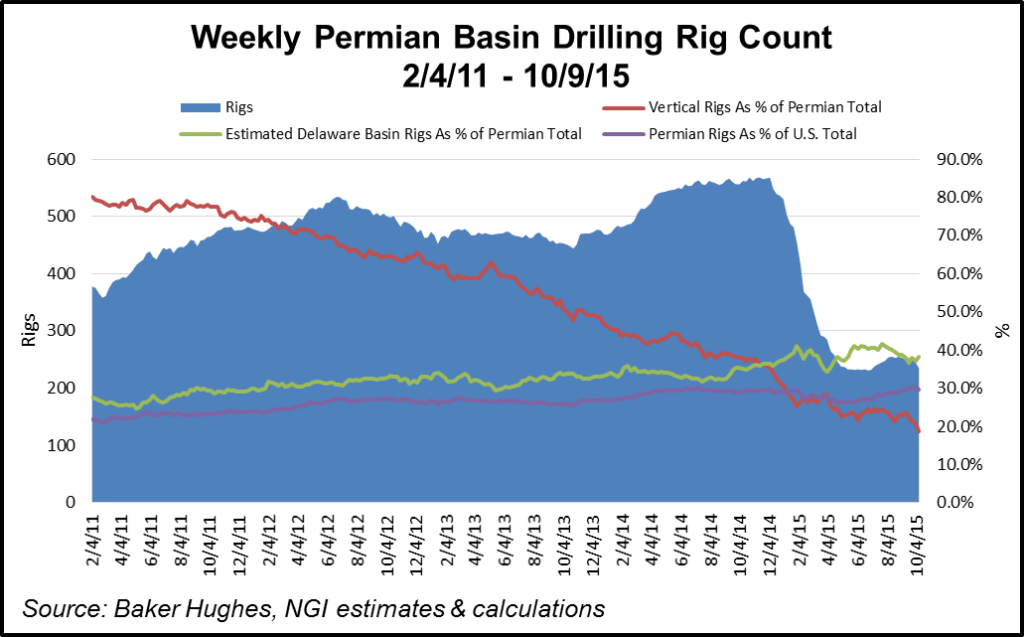
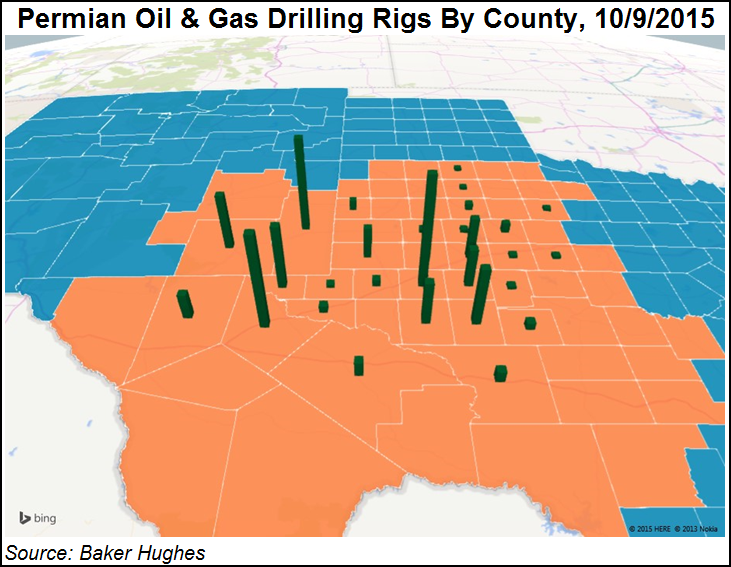
Three things stand out in the graph above that underscore the renewed interest in the Permian. First, it is home to most of the U.S. drilling activity. In February 2011, the Permian claimed 21.7% of the total working rigs in the United States. That figure climbed to 29.6% as of early October 2015. Second, which we believe represents an important secular change, is that horizontal and directional drilling are becoming far more prevalent in the region. More traditional, vertical rigs represented 80% of the rigs in the Permian in February 2011, but that figure was down to just 19% in early October 2015. Finally, the chart illustrates the rise of the Delaware Basin, which we estimate has increased from 27% of all Permian rigs at work in early February 2011 to nearly 40% in early October 2015.
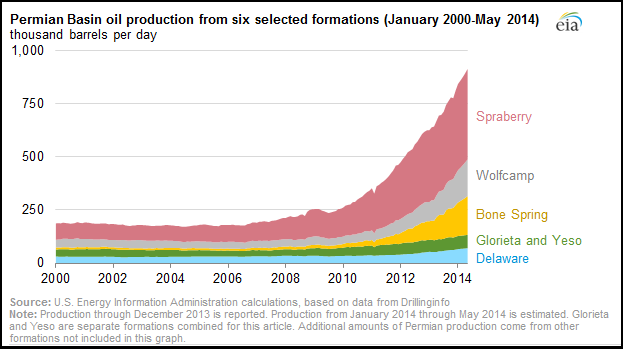
As shown in the EIA graph above, the Spraberry and Bone Spring formations have yielded most of the gains in production thus far, in no small part because those formations were already well known to operators. Both were drilled vertically for years, are served by an established infrastructure, and have responded well to horizontal drilling, thus leading to the ramp in their production. However, another driver behind the current and expected future rise in Permian production is coming from the Wolfcamp and the Delaware sub-basin.
Drilling in the Wolfcamp, which underlies much of the Permian Basin, has risen in prominence thanks to horizontal drilling and hydraulic fracturing. Industry consultant Wood Mackenzie estimated that spending in the Wolfcamp during 2014 would near that of the Bakken, with capital expenditures surpassing $12 billion — about 80% of Bakken spend. The Wolfcamp was ranked third in tight oil play spending behind the Eagle Ford and the Bakken shales in 2014 and could overtake the Bakken for the No. 2 spot as early as 2017. Wolfcamp crude and condensate production is expected to reach 700,000 b/d by the end of the decade, according to Wood Mackenzie.
Many of the biggest operators have legacy holdings in the Permian that have allowed more time to experiment with fracturing and laterals. ExxonMobil Corp., Occidental Petroleum Corp., ConocoPhillips and Apache Corp. are among those that have had acreage for years. But it’s a hot spot for the newbies as well as foreign operators.
ExxonMobil., already the biggest natural gas producer in the United States, has a Permian leasehold that extends more than 1.5 million net acres, but it still has not been satisfied. Between January 2014 through August 2015, subsidiary XTO Energy Inc. executed five agreements in the Permian’s Midland sub-basin, giving it another 135,000 operated net acres (see Shale Daily, Aug. 6, 2015).
“The recent emergence of strong Lower Spraberry results, combined with the established Wolfcamp intervals, demonstrates the significant potential of the stacked pays in the Midland Basin core,” said XTO President Randy Cleveland.
Encana Corp., long a top North American player, didn’t enter the Permian until late 2014, paying $7.1 billion to acquire Athlon Energy Inc. The deal handed the Calgary operator 140,000 net acres in the heart of the Midland sub-basin (see Shale Daily, Sept .29, 2014). EOG Resources Inc. rarely makes acquisitions, but in late 2015 it bolted-on 26,000 net acres in the Delaware through three transactions for $368 million (see Shale Daily Nov. 9, 2015).
Oxy, one of the biggest legacy leaseholders in the Permian, is finding better returns in Texas than anywhere else, including in the Bakken Shale. In fact, returns in the Permian were strong enough that Oxy decided to sell its Bakken acreage in 2015 (see Shale Daily, Oct. 29, 2015).
“Simply put, acreage in North Dakota cannot compete with our acreage in the Permian,” CEO Vicki Hollub said. Permian production hit 116,000 boe/d in 3Q2015, 6% higher sequentially and 51% higher year/year.
Devon Energy Corp. is another good example of how experimentation is paying dividends in the play. The Oklahoma City explorer has holdings across the United States, but it considers the Delaware to be its crown jewel (see Shale Daily, Nov. 4, 2015).
“Really, our most intense focus area for 2016 will definitely be the Permian Basin and our work in the Delaware,” said Devon’s Tony D. Vaughn, executive vice president of exploration and production. “As we’ve approached our work in the Delaware Basin, we’ve really highlighted the second Bone Spring and the Delaware Sands as probably being the two most prolific from a rate-of-return perspective…We’ll probably see us have a little bit more influence from the Leonard interval in 2016.
“We’re also contemplating really how to appropriately develop the stacked-pay sands. And the Wolfcamp’s got up to four different intervals. We have assessed that. We’re getting a lot of industry activity on the Texas side of the basin moving right up to our play. Now we’re starting to see the industry…understanding the play.”
Pioneer Natural Resources Co. also relies on the Permian to fuel its onshore growth. The largest leaseholder in the Spraberry/Wolfcamp had a total of 800,000 gross acres in 2015, a contiguous land holding that allows for drilling horizontals with laterals of 7,500-10,000 feet. And that matters to the bottom line. “The longer lateral length wells pay out in approximately 18 months, which is twice as fast as the shorter lateral length wells,” management said (see Shale Daily, Nov. 3, 2015).
Longer laterals in the Permian also were proving to be a boon to Cimarex Energy Co. during 2015. During the third quarter, it had 13 wells with 10,000-foot laterals targeting the Wolfcamp D interval with average initial production of 2,308 boe/d (see Shale Daily, Nov. 5, 2015). Five more 10,000-foot laterals were planned for early 2016.
Apache Corp.’s extensive legacy holdings in the Permian were said to be a major reason that Anadarko Petroleum Corp., another Permian player, attempted an $18 billion merger in late 2015 (see Shale Daily, Nov. 11, 2015). In the U.S. onshore, the Permian is Apache’s the biggest focus, where it has worked for decades. Although it had dropped all but 10 of its 42 rigs in the play by 3Q2015 because of sliding oil prices, the Houston producer still reported a 14% gain in natural gas production from 3Q2014, with oil output down by 1%.
Apache was targeting the Bone Spring and Wolfcamp formations, and it also was working in the Spraberry. In addition, the operator branched out to the Yeso formation in the Northwest Shelf in 2015, where average completed well costs had fallen by half through experimentation.
Permian-focused Concho Resources Inc. is another example of a smaller producer that’s performing above average in the Permian. During 3Q2015, the operator had record production, despite low oil prices, beating its guidance with output of 149,304 boe/d, a 31.6% increase year/year (see Shale Daily, Nov. 16, 2015). Horizontals in the Delaware produced 88,500 boe/d, a 60% jump from 2014 and 8% higher sequentially.
“The blocking and tackling that we’ve talked about at the end of this quarter, and the real high quality acreage we were able to add in our core areas at really good prices, that’s the kind of activity we’re going to continue to stay focused on,” Concho CEO Tim Leach said. “We live in the Permian Basin, so we think we’re aware of everything that’s going on out here. Our day-to-day business is this focus on our core areas and the smaller stuff.”
There is some disagreement among several prominent sources as to which counties should be included in the Permian Basin. The Railroad Commission of Texas (RRC) includes all counties within its Districts 7C, 8, and 8A in the varying production and other operating statistics that appear on the Permian portion of its website, yet it includes a different slate of counties in its official definition of the play on that same site. The U.S. Energy Information Administration assumes its own mix of counties in its production estimate of the play, and the Permian Basin Coalition uses a slightly different combination as well. We summarize these variances in the table below.
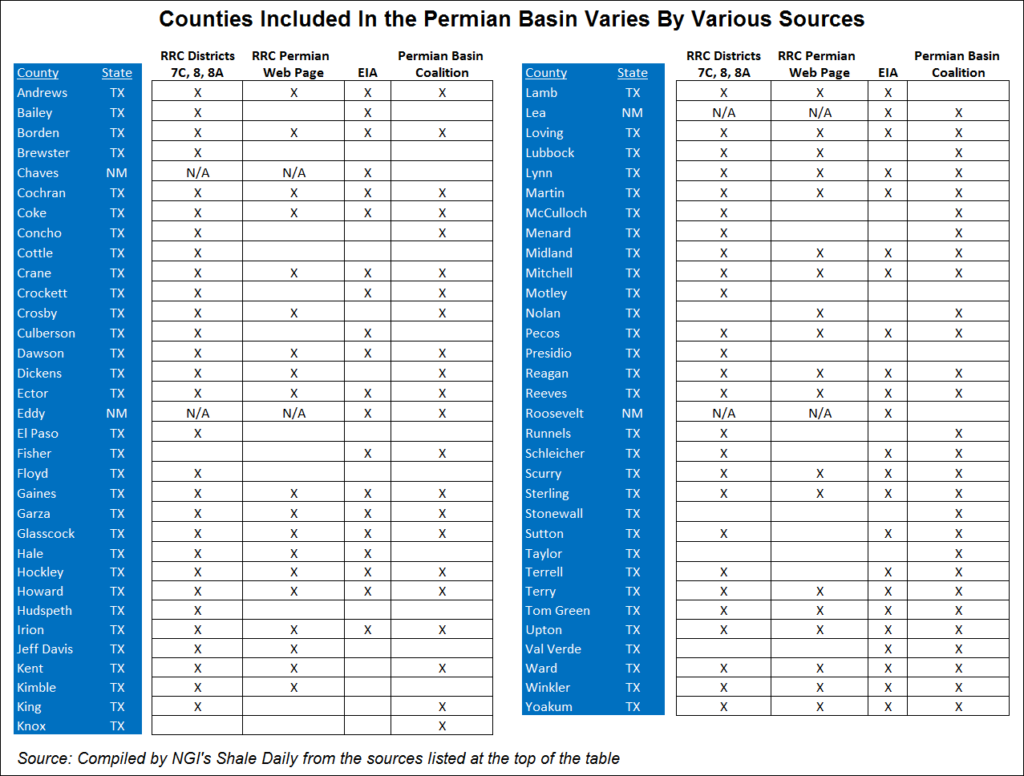
Counties
Texas: Andrews, Borden, Brewster, Cochran, Coke, Concho, Cottle, Crane, Crockett, Crosby, Culberson, Dawson, Dickens, Ector, Edwards, Fisher, Floyd, Gaines, Garza, Glasscock, Hale, Hockley, Howard, Hudspeth, Irion, Jeff Davis, Kent, Kimble, King, Knox, Lamb, Loving, Lubbock, Lynn, Martin, McCulloch, Menard, Midland, Mitchell, Motley, Nolan, Pecos, Presidio, Reagan, Reeves, Runnels, Schleicher, Scurry, Sterling, Stonewall, Sutton, Taylor, Terrell, Terry, Tom Green, Upton, Val Verde, Ward, Winkler, Yoakum
New Mexico: Chaves, Eddy, Lea

Local Major Pipelines
Natural Gas: Atmos, Comanche Trail (proposed), El Paso, Energy Transfer, Enterprise Texas Pipeline, KM Texas, NGPL, Northern Natural, Oneok Westex Transmission, Roadrunner Transmission (proposed), Trans Pecos (proposed), Transwestern, Waha Hub
Crude Oil: Amdel (Sunoco), Basin, BP Pipelines, BridgeTex, Centurion, Enterprise Crude Pipeline, Kinder Morgan Wink Pipeline, Longhorn, Mesa (Plains), Mesa (Sunoco), Mobil, Oasis, Pecos River, Permian Express II, Phillips 66, Plains Cactus, Shell Pipeline, Sunoco Pipeline, Sunrise Pipeline (Plains), SXL, SXL Permian Express, West Texas Gulf (Sunoco), West Texas Pipeline
NGLs: Chapparal, Energy Transfer, Halley Liquids Line, JAL Products Line (Regency Energy Services), Lone Star Express (proposed), Lone Star West Texas, Mesquite Liquids System, MexTex NGL System, Pecos River, Permian Connector, Phillips 66, Quanah Pipeline, Rocky Mountain (Enterprise Products), Sand Hills, Seminole, Targa Midstream, West Texas LPG (Chevron)
Certainly higher oil prices have played a big role, at least before the recent slide in WTI prices below $70 per barrel. But the other main reason is that unconventional formations are quickly rising to prominence in the Permian, and that is attracting more investment capital to the region. Many counties in the Permian are underlain by several “stacked” formations that not only offer more potential reserves over the same acreage, but also improve well economics because operators can target multiple pay zones with the same well bore. For example, the Midland Basin
More information about Shale Plays:
Utica | Bakken | Tuscaloosa Marine Shale | Haynesville | Rogersville | Montney | Arkoma-Woodford | Eastern Canada | Barnett | Cana-Woodford | Eaglebine | Duvernay | Fayettville | Granite Wash | Horn River | Green River Basin | Lower Smackover / Brown Dense Shale | Mississippian Lime | Monterey | Niobrara – DJ Basin | Oklahoma Liquids Play | Marcellus | Eagle Ford | Upper Devonian / Huron | Uinta | San Juan | Power River | Paradox
 Shale Daily
 Shale Datafeed