Markets | NGI All News Access | NGI The Weekly Gas Market Report
No Sign of Wintry Blasts; December NatGas Forwards Plunge 34 Cents First Week at Front of Curve
The steep losses that were seen as November rolled off the natural gas forwards curve paled in comparison to the cannonball splash December made during its first week at the front of the curve, when prices plummeted an average 34.4 cents between Oct. 28 and Nov. 3, and several markets lost upwards of 50 cents, according to NGI’s Forward Look.
The Nymex futures strip set the tone for the hefty sell-off. Nymex December futures tumbled about 34 cents during that time, January futures plunged 31 cents, the balance of winter (January-March) dropped 30 cents, summer 2017 fell 17 cents and the winter 2017-2018 slid 15 cents.
On a national level, forwards prices essentially mirrored the Nymex. December forwards prices were down an average 34 cents, January forwards were down an average 32 cents, the balance of winter was down an average 30 cents, summer 2017 was down an average 17 cents and the winter 2017-2018 was down an average 15 cents, Forward Look data shows.
With gas storage inventories nearing the critical 4 Tcf mark and winter weather still at least a couple of weeks away, many in the market aren’t surprised at the steep declines seen in the gas market during the last couple of weeks.
“We agree with the recent reversal, having long held a high conviction call for late-autumn price weakening to align with our record-reaching end-of-October storage finish, which has now been realised,” said Societe Generale’s Breanne Dougherty, natural gas analyst.
Indeed, storage inventories climbed another 54 Bcf for the week ending Oct. 28, according to the U.S. Energy Information Administration. And while this injection was slightly lower than expectations, it propelled inventories to 3.963 Tcf, 48 Bcf higher than last year’s all-time high and 173 Bcf higher than the five-year average.
Interestingly, injections in the South Central region, which had been in withdrawal mode for much of the year, accounted for more than half of this week’s storage injection, +34 Bcf vs. +15 Bcf in 2015.
Meanwhile, overall storage inventories are expected to swell even further as the fall season continues to offer few opportunities for weather-related increases in demand. The five-year average pace for next week implies a +34 Bcf build in storage, which would bring absolute levels to 3.997 Tcf, a hair below the psychologically important 4 Tcf.
“For week ended 28 October, core fundamentals tightened, which is very typical for the time of year given the transition out of the shoulder season and into the heating season. That transition this year, however, does seem to be particularly sluggish, with warm temperatures across most of the continent helping keep the fundamentals looser than they really should be for this time of year,” Dougherty said.
Residential/commercial (R/C) loads are creeping up, albeit slowly, she said. A week-on-week increase of 5.4 Bcf/d represents a notable 36% gain; however, R/C loads are still trending very low for the time of year. Warm weather across most of the continent is preventing heating loads from ramping as the market moves through the final weeks of injection, she said.
Indeed, the warm weather is taking its toll on cash markets as well. Henry Hub cash prices have fallen nearly $1 in less than two weeks, essentially erasing much of its 2016 gains.
Also leading to the dramatic fall in cash, and likely futures, is diminishing spare capacity in salt dome storage caverns, analysts with Mobius Risk Group said. The most recent storage data shows salt dome storage not only closed the deficit to last year, but climbed marginally higher than the comparable week in 2015. As of Oct. 28, salt dome inventory was at 372 Bcf, 2 Bcf higher than last year. The all-time high of 382 Bcf was established during the week ending Nov. 20, 2015.
Further downside risk will remain in place until weather forecasts support a flip to net storage withdrawals, and at this time, forecasts suggest this could be mid-November or later, the Houston-based company said.
“Midday updates on Thursday did show significantly cooler changes in the 11-15 period, but these were focused in the southeastern U.S., where the demand impact will be negative. The long-awaited start to Fall will be appreciated by local residents in the Southeast, but cooling demand declines will be bearish for natural gas prices,” Mobius said.
Unless weather substantially changes, upside risk is likely limited to the 100-day moving average at $2.846, and in the event of bearish weather being rolled forward, the market could see a retest of fundamental support at $2.50, it said. However, a colder-than-normal shift in North American temperatures would likely spark a sharp rally back closer to $3/MMBtu or higher.
In its Friday note to clients, forecaster NatGasWeather said cooling is still expected into the east-central U.S. for mid-November, but models continue struggling on exactly how much cold air will ultimately arrive. “Essentially, the weather data keeps teasing cold is coming, but then fails to convincingly prove it,” the weather forecaster said.
As an example, the overnight 00z GFS operational solution showed another flip to a milder solution after a colder midday run, although its ensembles remain relatively chilly. This continues to highlight inconsistencies that have plagued the weather models the past few weeks, it said.
“If relatively chilly weather systems were to finally arrive for the second half of the month, the nat gas markets could gradually view forthcoming patterns as getting a bit more intimidating, especially as milder days on the front end of the forecast period drop off in favor of colder ones on the back end,” NatGasWeather said.
The forecaster noted that while the recent sell-off in futures prices has been impressive, the official climatological start of the withdrawal season is still a couple weeks out, highlighting that there is still an entire winter season to get through. “Essentially, this fall season has failed to produce any meaningful cold blasts, but there’s still plenty of time left to reverse much of the damage, as long as several much stronger than normal draws on supplies occur before the official start of winter,” it said.
But if milder/bearish patterns were to hold into early December, already impatient markets will grow even more frustrated. It’s possible prices could be due for a bounce after the recent collapse, although, for any sort of sustained rally, forthcoming suites of weather data will need to become convincingly colder or the sell-off could resume, NatGasWeather said.
“There is no doubt that this overhang will disappear quickly once heating loads begin to rise materially; however, the weather is the most important factor affecting that,” Dougherty said. “The longer the mild weather pattern holds, the slower the transition to storage deficit. Our balances have that transition now delayed until December.”
Meanwhile, it’s worth noting that the rapid sell-off in futures comes as many in the market are listening in earnest to third-quarter earnings calls. A multitude of heavy hitters in the E&P sector have already held their calls, and at first glance, it appears that the natural gas industry is on the cusp of an upswing as producers are calling for increased production for the balance of 2016 and through 2017.
But upon a closer listen, it would seem that many of these producers are planning on ramping up their output not by adding rigs but by drilling longer laterals and utilizing other efficiencies.
During an analyst day conference in mid-October, Chesapeake CEO Doug Lawler highlighted the progress made to date by the debt-ridden independent, despite depressed commodity prices (see Shale Daily, Oct. 20). He divulged a tad more information Thursday about the super laterals being drilled in the Haynesville, which he has dubbed “proppant-geddon” because so much sand is being used to fracture (frack) wells to increase output.
“In the Haynesville, we are currently fracking a 10,000-foot lateral well with 50 million pounds of sand, or roughly 5,000 pounds/lateral foot at ultra-tight cluster spacing,” Lawler said. “This completion will have the largest number of stages we have ever pumped in the Haynesville in a single well, and the well should be placed to sales in the next few weeks…”
And in a Friday note to clients, Tudor, Pickering, Holt & Co. (TPH) said operators across the U.S. are pushing proppant intensity on optimized completions. Anadarko will likely be leading the charge in the Delaware Basin as management has now leveled its base completion design in-basin to about 2,500lbs/ft, but is testing on a leading edge basis wells that will double both proppant and fluid volumes from this base design, TPH said.
“Data points continue to support our view that proppant demand in 2017 will eclipse peak levels last seen in 2014, potentially increasing D&C [drilling and completion] cost by 10-15% purely on in-basin inflation dynamics,” it said.
The time for utilizing efficiencies such as these could not come at a better time as the harsh freefall the market’s been in the last couple of weeks has dramatically lowered prices far out the forward curve, disincentivizing producers to add more rigs.
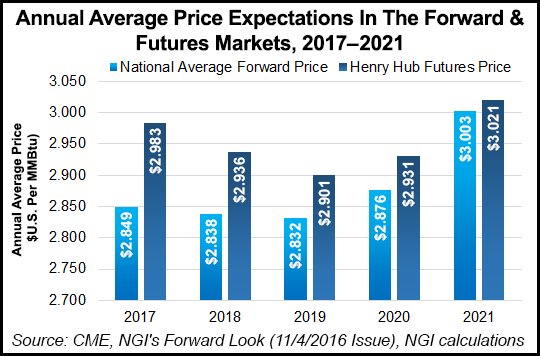
NGI‘s National Average Forward price for 2017 is sitting at just $2.849 as of Nov. 3. In the futures market, the 2017 Henry Hub average price sits at $2.983.
“Contrary to expectations of rising prices, these two markets (forward and futures) are currently anticipating price declines on an annual basis for the next three years,” said NGI’sNate Harrison, natural gas analyst.
In the forward market, the annualized national average price is expected to fall from the $2.849 in 2017 to $2.838 in 2018 and further to $2.832 in 2019 before recovering slightly in 2020 with a price of $2.876, Harrison said.
Likewise, the futures market shows the Henry Hub contract moving further below a three-handle as it falls to average $2.936 in 2018 and then $2.901 in 2019. “It appears that, on an annual basis, $3 natural gas just isn’t on the table at this point,” Harrison said.
© 2024 Natural Gas Intelligence. All rights reserved.
ISSN © 1532-1231 | ISSN © 2577-9877 | ISSN © 1532-1266 |