NGI Mexico GPI | Markets | NGI All News Access
***NGI’s Mexico GPI Announces Changes to Our Various Price Tables***
Natural Gas Intelligence (NGI) has made several changes to the various tables that appear in our Mexico Gas Price Index (MGPI) newsletter, as part of our ongoing effort to keep pace with and better serve the rapidly evolving deregulated natural gas market in Mexico.
The changes impact three of our tables: Estimated U.S. to Mexico Natural Gas Cost Plus Transport Prices, U.S./Mexico Spot Market Prices, and Forward Curves at U.S. Locations Key to Mexico Exports.
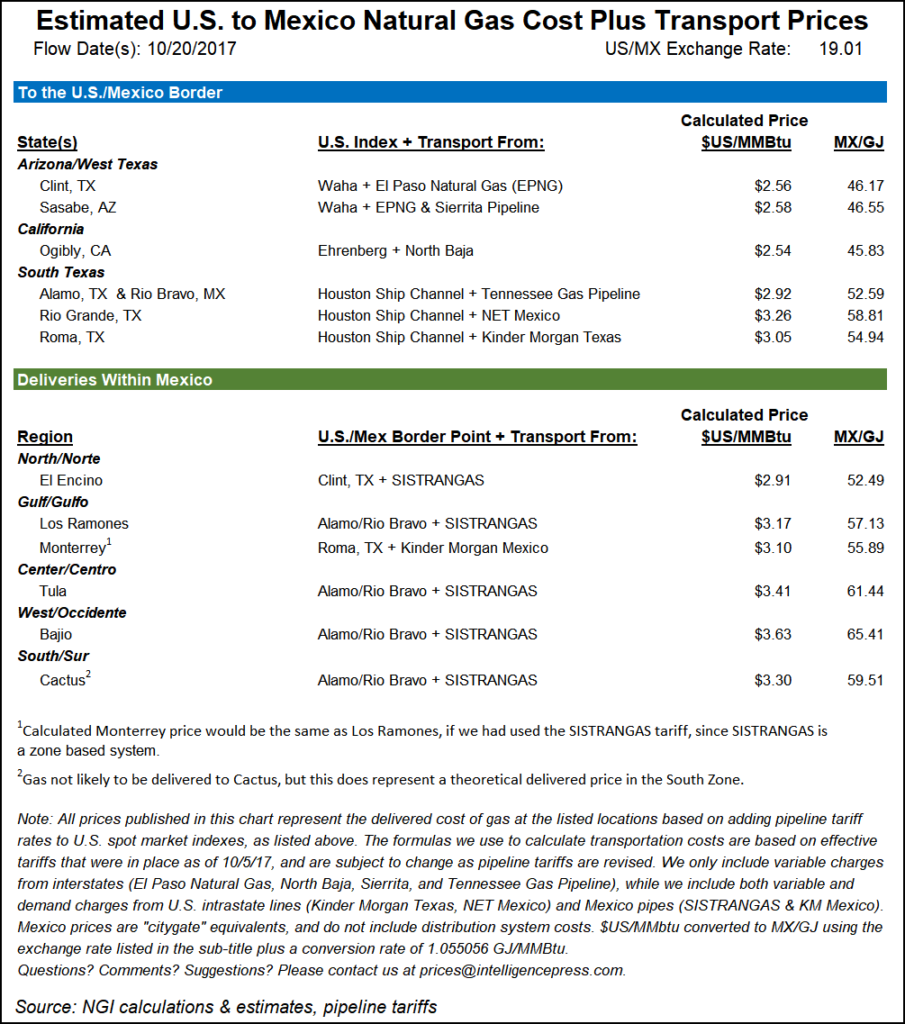
U.S. to Mexico Natural Gas Cost Plus Transport Prices
â— We have changed the initial point-of-reference price for the border prices in South Texas from our NGI’s Daily Gas Price Index South Texas regional average to the Houston Ship Channel. Although we believe our South Texas regional average is more representative of supply and demand characteristics closer to the U.S./Mexico border, we realize the majority of gas currently being sold in Mexico is being priced off the Houston Ship Channel index. Thus, this change better conforms with the current industry practice.
â— We also altered the formulas we use for calculating transportation along the intrastate pipelines NET Mexico (to Rio Grande, TX) and Kinder Morgan Texas to Roma, TX, to better estimate what we believe are current rates on those systems. These changes will add more transportation costs to these calculations than we were incorporating previously.
â— Our delivered within Mexico price calculations now reflect rates along SISTRANGAS that are in effect from October through December of this year. We will continue to update our formulas to reflect the most updated effective tariff rates for all the pipelines we use in our calculations in the future.
â— In addition, we have corrected two slight errors to our table: 1.) We had been listing Kinder Morgan Border as the feeder pipe into Roma, TX, but it is in fact Kinder Morgan Texas. 2.) In our footnote, we inadvertently stated we do not include capacity charges along Kinder Morgan Mexico (Mier-Monterrey) in our calculations, when in fact we have been and will continue to include those charges. Fortunately, the KM Mexico capacity charge is fairly small, so including it does not make a significant difference to the calculated price. NGI regrets both errors.
U.S./Mexico Spot Market Prices

â— We moved our Henry Hub and Houston Ship Channel prices to a new section, called East Texas/South Louisiana.
â— Added NGPL S. TX to our South Texas section.
â— Since we are no longer using NGI’s South Texas Regional Average that appears in our Daily GPI newsletter as the basis of our cost-plus calculations (as explained above), the South Texas average we now publish is a simple mathematical average of the three interstate pipelines that appear in this section: NGPL S TX, Tennessee Zone 0 S TX, and TETCO S TX. This also ties into the changes we have made to our Forward Curves table, which we describe below.
Forward Curves at U.S. Locations Key to Mexico Exports

â— Added calendar year 2018 & 2019 forward prices to all our listed points. As a result, we removed the One Year from the title of this chart.
â— Moved Henry Hub and Houston Ship Channel to a separate East Texas/South Louisiana section, to match what we did in the spot prices table.
â— Included NGPL S. TX in the South Texas section, as well as a simple average of the three pipelines that comprise this section of the table: NGPL S TX, Tennessee Zone 0 S TX, and TETCO S TX. This again matches what we did in the spot prices table.
â— Created a separate Waha-to-South Texas basis spread, which will allow our readers to monitor the ever-changing differentials between those two key areas of Texas, particularly since those two areas will be the main export regions in Mexico going forward.
We hope the changes we have made to MGPI will make our publication more timely and useful. As always, we would love to hear any feedback you may have, which you can do by e-mailing us at prices@naturalgasintel.com, or calling Dexter Steis at (703) 318-8848.
© 2024 Natural Gas Intelligence. All rights reserved.
ISSN © 2577-9877 | ISSN © 2577-9966 |