NGI Data | Markets | NGI All News Access
Natural Gas Futures Steady as Oil Patch in Turmoil
Amid upheaval in the oil patch and uncertainty over the demand impacts of the coronavirus pandemic, natural gas futures managed to hold relatively steady in Friday’s trading. The April Nymex contract rolled off the board at $1.634/MMBtu, off 0.3 cents day/day. The May contract slid 1.8 cents to $1.671.
Meanwhile, pressured by bearish near-term fundamentals, spot prices skidded lower across most regions; NGI’s Spot Gas National Avg. dropped 11.5 cents to $1.270.
Looking at the supply picture, daily estimates from Genscape Inc. as of Friday showed a “very modest retreat” for Lower 48 production. Earlier in the week, output fell to a 48-day low of 92.1 Bcf/d and remained in the 92 Bcf/d range over the next four days, according to the firm.
“Comparing the past four-day average to the prior month-to-date average, we see every region down, with the lone exception of the Rockies,” Genscape senior natural gas analyst Rick Margolin said. “Texas production declines are leading the way, down 0.35 Bcf/d, followed by nearly 0.26 Bcf/d of drops out of the East.”
As of Friday, the Permian Basin and Midcontinent each were showing declines of around 0.16 Bcf/d versus the prior month-to-date average, according to Margolin.
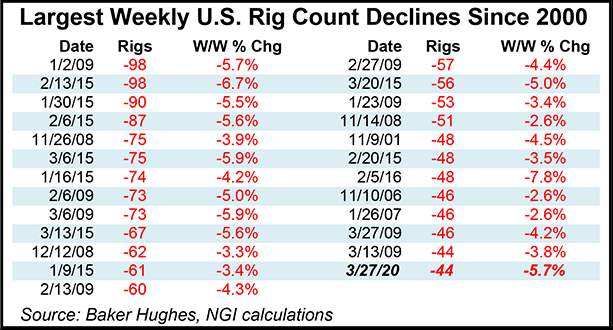
The collapse in oil prices earlier this month has led market observers to hypothesize that a corresponding contraction in drilling activity in the U.S. onshore would lead to declines in associated production, thus relieving the gas supply glut. Those seeking data for corroboration need look no further than the latest weekly rig count from Baker Hughes Co. (BKR). The oilfield services company reported a 44-rig drop in its U.S. count for the week ended Friday, ranking among the most severe weekly declines over the past two decades.
The BKR data, which showed 40 oil rigs exiting the patch in only one week, painted a grim picture of the circumstances facing U.S. upstream players. Still, the pace of retrenchment is not without precedent, an NGI analysis of BKR data shows.
“Since the turn of the century, we’ve seen this happen a number of times, especially after the banking crisis in 2008 and 2009, and the drop in crude prices in 2015,” said NGI’s Patrick Rau, director of strategy and research. “Keep in mind that gas rigs today do more than they did back then, so the percentage decrease is probably the more relevant figure. But even on that metric, there were still bigger declines.”
The week ending Friday saw a 5.7% decline in the domestic rig count, BKR data showed. Looking back at the worst weeks for U.S. drillers over the past two decades, the largest weekly decline in absolute terms was a drop of 98 rigs, recorded on two separate occasions, in early 2009 and in early 2015. In percentage terms, the largest drop occurred in early 2016, when 48 rigs — or 7.8% of the total — were sent packing in the United States.
Meanwhile, the Energy Information Administration (EIA) on Thursday reported a 29 Bcf weekly withdrawal from U.S. natural gas stocks, lighter than the 39 Bcf withdrawal recorded in the year-ago period and the five-year average pull of 40 Bcf. Total Lower 48 working gas in underground storage stood at 2,005 Bcf as of March 20, 888 Bcf (79.5%) above year-ago stocks and 292 Bcf (17.0%) higher than the five-year average.
Analysts at Tudor, Pickering, Holt & Co. (TPH) described the week’s EIA storage number as a “non-event.” Not only was the figure close to consensus, but the market’s focus has shifted to demand destruction amid the Covid-19 pandemic and weakness in liquefied natural gas (LNG) pricing, they said.
“Four days into shutdowns, the impact on gas demand is far from clear,” the TPH analysts said. “On a week/week basis, demand is down 1.9 Bcf/d, but residential/commercial makes up half the delta and is the most prone to seasonal fluctuations; industrial demand is down 0.3 Bcf/d week/week and 0.8 Bcf/d year/year.”
As for LNG, TPH estimates Friday showed utilization for U.S. exports at 106%, with Sabine Pass “running above 4 Bcf/d after averaging closer to 3 Bcf/d” in the week prior “due to weather issues. As we move through 2Q, we expect utilization to come down, based on our spot spread estimates that show shipments to Europe out of the money from April through September.”
Shoulder season conditions and the strain of social distancing measures on economic activity offered little upside for prices in Friday’s trading. Deals for weekend and Monday delivery saw discounts from coast to coast.
If recent trends persist, Northeast hubs could struggle to hang onto a $1-handle. In Friday’s trading, Transco Zone 6 NY tumbled 15.5 cents to average $1.125. Farther upstream in Appalachia, Dominion South slid 15.0 cents to $1.095.
In the Midwest, Chicago Citygate fell 8.5 cents to $1.395, while over on the West Coast, PG&E Citygate dropped 13.0 cents to $2.125.
Near-term weather forecasts had shifted warmer Friday, while expectations had trended cooler for the upcoming work week, Genscape’s Margolin said.
Genscape meteorologists were forecasting the next four days would see eight heating degree days warmer compared to expectations earlier in the week, the analyst said. By contrast, the firm revised its forecast colder for the period from Tuesday through April 6, adding 32 Bcf, or 5 Bcf/d, of expected demand.
“Demand over the next 10 days is currently projected to average right at 81 Bcf/d,” Margolin said Friday. “This estimate is inclusive of adjustments we have already made for Covid-19 destructive impacts, which we roughly estimate to be about a 4% reduction from ”normal’ levels.”
West Texas was the one region where spot prices consistently gained Friday, although hubs there entered the day at steep discounts. El Paso Permian picked up 3.5 cents to average 27.0 cents.
© 2024 Natural Gas Intelligence. All rights reserved.
ISSN © 1532-1231 | ISSN © 2577-9877 |