NGI All News Access | E&P | Markets
Natural Gas Forwards Plummet as Market Struggles to Digest ‘Very Difficult Metrics’
Natural gas forward prices continued to collapse during the Jan. 16-22 period, with traditionally premium-priced February contracts sporting $1 handles across most of the country.
The prompt month plunged by an average 23 cents as persistently warmer trends were modeled in long-range weather outlooks, according to NGI’s Forward Look. The balance of winter (February-March) tumbled 19 cents.
With plump storage inventories expected to swell even more in the coming weeks, summer was not immune to the steep sell-off. Prices for the April-October strip plummeted an average 10 cents, while the winter 2020-21 contract lost 7 cents, Forward Look data showed.
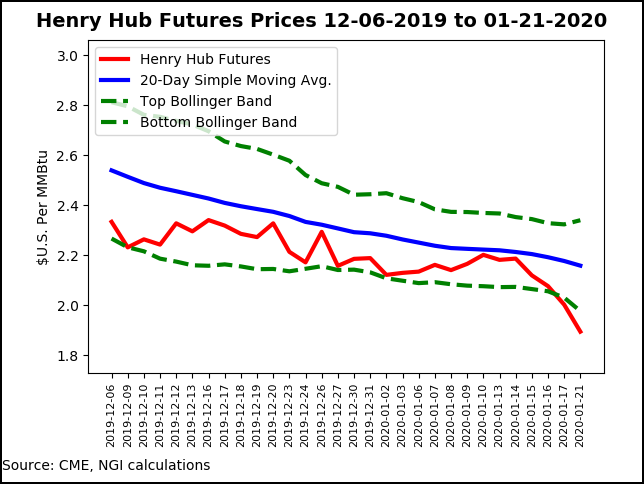
The carnage in the gas market kicked up a notch once traders returned from the Martin Luther King Jr. holiday. With even warmer changes made to the unusually mild long-range weather outlook, the February gas futures contract dropped 10.8 cents to settle at $1.895 Tuesday, the lowest level in four years. Prices staged a modest recovery on Wednesday and Thursday, but they remained several cents back of the $2 mark.
“Reaching multi-year lows is understandable considering the substantial capitulation in weather forecasts, and the now realistic probability that end-of-winter inventory could approach 1.9 Tcf,” said Mobius Risk Group. “If that does prove to be the case, weather-adjusted weekly storage injections would need to be more than 2.5 Bcf/d tight (bullish) year/year to avoid storage constraints, and this number would need to increase if summer temperatures are cooler than normal.”
Weather data as of Jan. 21 showed that from Nov. 1 through Feb. 4, the total heating degree day (HDD) count tallied the sixth warmest for that period in 69 years, according to Mobius. When zeroing in on the year-to-date period, the population-weighted HDD count is the third warmest on record.
“These are very difficult metrics for the market to digest without considering the possibility of inventory constraints later in the year,” the firm said. “In addition, utility-held storage must be dumped in a market that has lost a material amount of demand relative to normal, which is what the injected gas anticipated.”
On Thursday, the U.S. Energy Information Administration reported that inventories for the week ending Jan. 17 fell by 92 Bcf, a figure that fell in line with expectations. The reported draw was easily dwarfed by last year’s 152 Bcf pull and the five-year average withdrawal of 194 Bcf.
Total working gas in storage stood at 2,947 Bcf, which is 554 above year-ago levels and 251 Bcf above the five-year average, according to EIA.
The consistently warmer revisions to the late-January/early February outlook and the healthy supply picture have taken a toll on the forward curve. A $2-handle doesn’t appear in the forward curve until June 2020, and even that package was barely hanging early Friday.
What’s next for natural gas? First and foremost, as the past week has indicated, weather forecasts can turn on a dime and reshape the near-term market outlook, according to EBW Analytics Group. If even a portion of lost demand were to be recovered, it may help stabilize the market. If losses were to continue to accumulate, however, “watch out below.”
Second, as natural gas prices sink below $2.00, economic coal displacement may be nearing its peak for mid-winter potential, EBW said. Although natural gas is economically more competitive than coal in most circumstances, coal could remain online for reliability reasons to meet demand during mid-winter.
“As a result, near-term trading of Nymex gas may be dictated by market technicals, which are currently pointed in a bearish direction, and anticipation of producer announcements,” the firm said.
The latest production data already may be showing signs of a slowdown. Genscape Inc. on Friday said that Lower 48 production during the preceding seven days averaged 93.1 Bcf/d. That brings the month-to-date average to just a bit less than 93.7 Bcf/d.
“That lags our forecast for the month by about 1.5 Bcf/d,” Genscape senior natural gas analyst Rick Margolin said.
The largest delta is in the East, followed by the New Mexico Permian, Gulf Coast, Rockies and San Juan, according to Genscape. East region volumes continue to be hampered by maintenance events, while Western producing areas are driving daily national freeze-off estimates near 1.5 Bcf/d.
So far this month, Genscape’s Spring Rock production estimates show freeze-offs have curtailed a cumulative 15.8 Bcf of production (or a daily average of 656 MMcf/d).
The all-time daily production high of 95.88 Bcf/d printed on Nov. 30, while month-to-date production is trailing the December ’19 average by around 0.50 Bcf/d, according to the firm. Meanwhile, December 2019 production came in about 0.52 Bcf/d below November.
“If this month’s production finalizes below December 2019, it will mark the first time there have been two consecutive months of month/month declines since September and October of 2016,” Margolin said.
On the weather front, there were hints on Thursday that cold could arrive around Feb. 5-6, but then models reverted back warmer overnight. This was especially true in the European model, which showed less cold air into the northern United States Feb. 3-7, according to NatGasWeather.
The Global Forecast System also wasn’t as cold Feb. 6-8, the firm said. “This is a bearish development as the natural gas markets were likely expecting or hoping for stronger demand after Feb. 4, and any backing off after five weeks of bearish weather is likely to viewed as disappointing. Essentially, the weather data would need to trend back colder Feb. 4-7 th or bearish weather headwinds will continue through the first week of February.”
With market momentum heading further south and producer earnings that could provide some support likely still a month away, EBW said that reaching the 2016 multi-year low of only $1.611 is not only a possibility, “but may be the most likely market outcome by the spring.”
Although the Northeast was in store for a potent storm this weekend that could bring snow to portions of the central Appalachians, a warmer shift in the weather system resulted in regional forward prices posting the most substantial losses in the country.
“We are getting a strong indication now that a southerly wind will get going at most levels of the atmosphere as the storm moves in,” AccuWeather’s Brian Wimer, senior storm warning meteorologist, said. “That southerly flow should be enough to pull warmer air in from the ocean and the Gulf of Mexico and effectively avoid snow altogether in Washington, DC, Baltimore, Philadelphia, New York City and Boston.”
Locations where enough snow is likely to fall and accumulate are forecast to extend from the mountains of northern West Virginia and western Pennsylvania to the northern tier of Pennsylvania, western, central and northern New York state and northwestern New England, according to AccuWeather. From six to 10 inches of snow are forecast from northern New York state to the northern parts of Vermont and New Hampshire, as well as part of northwestern Maine.
By Sunday, temperatures are forecast to climb into the 40s in Boston, New York City and Philadelphia and near 50 in DC. And although other weather systems are on tap for the last week of January, none are forecast to tap into the Arctic air that is expected to remain far back into Canada.
New England’s Algonquin Citygate posted the largest decline in the country for the prompt-month contract. February plunged $1.12 from Jan. 16-22 to reach $3.735, according to Forward Look. The balance of winter was down 76 cents to $3.44, and the summer strip was down 15 cents to $2.11. WInter 2020-21 lost 22 cents to average $5.92.
The dramatic declines extended farther south as well. Transco Zone 6 NY February tumbled 79 cents to $2.863, the balance of winter fell 53 cents to $2.522 and the summer dropped 10 cents to $1.78. The winter 2020-21 strip was down 17 cents to $4.42.
Losses were not quite as extreme in Appalachia, but Texas Eastern M-3’s declines were nothing to sneeze at. The February contract dropped 55 cents from Jan. 16-22 to reach $2.54, and the balance of winter was down 37 cents to $2.287, Forward Look data show. Summer prices fell 12 cents to $1.75, and next winter declined 15 cents to $3.54.
On the pipeline front, Columbia Gulf Transmission began planned maintenance Friday that was set to last through Feb. 29 and “could limit up to 822 MMcf/d of southbound flow in central Kentucky,” according to Genscape.
Columbia Gulf also declared a force majeure Tuesday because of an “unplanned mechanical failure” at the Delhi compressor in Richland Parish, LA, impacting capacity through its “AlexSEG” and “DelhiSEG” locations. The operator estimated the restriction would last about two weeks. Genscape estimated the maintenance event could limit up to 230 MMcf/d of south-bound system flows through Louisiana.
Western markets also suffered steep losses. Southern California prices for February were down 53 cents from Jan. 16-22 to $3.41, according to Forward Look. The balance of winter fell 44 cents to $2.983, summer dropped a dime to $2.85 and the winter 2020-21 strip slipped a penny to $3.67.
Northwest Sumas February dropped 26 cents to $2.058, the balance of winter slid 18 cents to $1.907 and summer lost 10 cents to land at $1.91. The winter 2020-21 strip was flat at $3.13.
In the Permian Basin, February was down only 8 cents but averaged a modest 56 cents, Forward Look data show. The balance of winter was down 6 cents to 38.3 cents, and the summer strip fell 7 cents to 36 cents. Winter 2020-21 prices fell 8 cents to $1.01.
© 2024 Natural Gas Intelligence. All rights reserved.
ISSN © 1532-1231 | ISSN © 2577-9877 |