Natural Gas Bidweek Traders Price in February Winter Premiums as March Futures Retreat
Bidweek traders had plenty to mull as they locked in their February prices. On the one hand, a hefty close to the February futures contract appeared decidedly bullish on the arrival of strong heating demand to close out the winter. On the other, a whiplash reversal in the March contract suggested a market already discounting hefty January storage withdrawals, thanks to record-setting production numbers.
As forecasts over the past week advertised the potential for arctic cold to make a comeback in February, points across the Midwest and East, which saw plenty of price spikes during some positively frigid stretches in January, drove strong gains in this month’s bidweek trading action. NGI’s fixed price National Bidweek Average finished at $4.23/MMBtu, up 87 cents over January 2018, and 77 cents higher than the February 2017 average.
Points that showed significant volatility in January appeared to price in the risk of a return of Arctic chills and thrills in the month ahead.
Transco Zone 6 NY, which set a $175/MMBtu spot price record in early January during a perfect storm of wintry weather and pipeline constraints, added $4.08 to average $11.80 fixed, while it traded at an $8.165 positive basis for the month.
Farther south, fixed price trades on Transco Zone 5 — also home to spikes in January — averaged above $10.
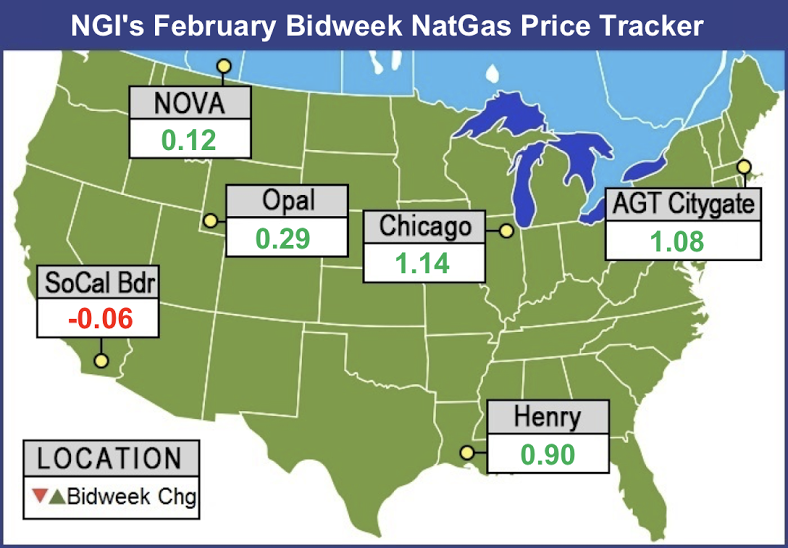
Algonquin Citygate, a perennial site of winter volatility, tacked on $1.08 to average $13.33. Points in the Midwest averaged healthy premiums to Henry Hub’s $3.64 average.
Dawn finished at $4.19 for February bidweek, up $1.16 month/month. In Ventura, IA, where winter weather sent prices rocketing as high as $100/MMBtu, Northern Natural Ventura averaged $4.90, up $1.39, while Northern Border Ventura finished at $4.83, up 46 cents on the month.
After the February futures contract rolled off the board at $3.631, physical traders had some tough questions to answer, INTL FCStone Financial Inc.’s Tom Saal, senior vice president, told NGI.
“Do I want to go into the month of February long or short on physical natural gas at $3.63?,” Saal asked. “That’s the highest close we’ve had in a long time, so if I’m a trader, do I stay at $3.63?
“…If the winter’s over, prices probably go down. If the winter’s not over and you think it’s over…you go into the month floating and it gets out of sight on you. So there’s a lot of uncertainty” surrounding whether $3.63 is sustainable.
If March’s first few trading days as the prompt month offered anything to go by, the answer to whether $3.50 futures would be sustainable was a resounding “no.” During the last days of bidweek, the outlook for a renewed push of Arctic chills into the Lower 48 that had supported the run-up in the February contract suddenly seemed a lot less supportive. March promptly went from trading above $3.20 to sinking below $3.
Analysts with Tudor, Pickering, Holt & Co. (TPH) attributed the futures “freefall” to a “slew of bearish fundamentals” that had “come center stage.”
“Lower 48 dry gas production hit a record 77.6 Bcf/d Monday, while heating degree day forecasts” for the first week of February “were lackluster, keeping with last week’s trend,” the analysts wrote. Meanwhile, commercial start-up of the Dominion Cove Point liquefied natural gas (LNG) export terminal was “delayed until March, further pushing out any LNG export growth above the current roughly 3 Bcf/d ceiling.”
Bulls could find solace knowing that the potential “winter uplift in demand isn’t entirely over — forecasts predict another bout of arctic temperatures showing up across the eastern United States around mid-February.
However, the arctic weather that had been expected to pour in for the month was looking significantly less impressive versus previous expectations, according to forecasters.
“While numerous weather systems and associated cold blasts will sweep across the northern and eastern United States into mid-February, the amount of frigid Arctic air being tapped out of South Canada has become less impressive compared to what the data was showing to start the week,” NatGasWeather.com said Thursday.
“…With prices back under $3 through the summer strip, cold will again be needed to show up in the weather maps to turn sentiment back bullish…Of course, Lower 48 production setting new record highs…certainly didn’t help the bullish case.”
Lower 48 dry gas production set a new record during bidweek, according to PointLogic Energy. Data showed Lower 48 output reaching 77.6 Bcf on Tuesday (Jan. 30), “the highest single day of natural gas production in U.S. history,” analyst Robert Applegate said at the time.
The Northeast region has stood out as a driver of the growth. “The Northeast’s top 10 dry gas production days have all come in the last 50 days,” Applegate said. “Since October, the Northeast has made huge gains in production, going from 24.3 Bcf/d for the month to Jan. 31’s value of 26.7 Bcf.”
Analysts with Jefferies LLC pointed to numbers showing production surpassing the 78 Bcf/d mark.
“Supply in the first half of January was impacted by freeze-offs and averaged 75.5 Bcf/d (including falling as low as 72.6 Bcf/d on a single day), but production rebounded in the back half of the month, averaging 77.2 Bcf/d, roughly in line with December 2017 levels,” analysts said. “Supply reached a new daily high over the last week, surpassing 78 Bcf/d for the first time and has since exceeded that level on three days.”
The Energy Information Administration’s (EIA) first storage report to arrive in February painted a picture of loosening fundamentals after production freeze-offs and elevated demand led to some mammoth withdrawals during the month of January.
The EIA reported on Thursday morning a 99 Bcf withdrawal from U.S. gas stocks for the week ending Jan. 26. That’s versus a year-ago withdrawal of 92 Bcf and a five-year average withdrawal of 160 Bcf. The 99 Bcf pull was a far cry from the 288 Bcf withdrawal reported the week before, not to mention the record-setting 359 Bcf pull reported in early January.
As the number crossed trading desks at 10:30 a.m. EDT, the March contract briefly dipped below $2.850 before returning to the $2.855-2.875 area, down around 13 cents from Wednesday’s settlement. By 11 a.m. EDT on Thursday, March was trading around $2.875.
The price action on the March contract Thursday morning stood in stark contrast to the final few trading days of the February contract. Prior to the report, the market had been expecting a withdrawal close to the actual figure. The average taken from a Reuters survey of traders and analysts had showed the market expecting a 104 Bcf withdrawal.
PointLogic Energy on Monday estimated a 91 Bcf withdrawal for the week ending Jan. 26. “At this level, net withdrawals would come in 197 Bcf below last week’s reported withdrawal as milder weather spread across the East, Midwest and South Central regions week-on-week,” analysts said in a note. “Additionally, injection demand in the South Central region’s salt cavern storage facilities picked up significantly.”
Kyle Cooper of ION Energy estimated a pull of 111 Bcf. Stephen Smith Energy Associates revised its estimate Tuesday to a withdrawal of 101 Bcf, after previously calling for a 98 Bcf pull. That’s versus a seasonally normal draw of 159 Bcf based on 2006-2010 norms, according to the firm.
“This fits perfectly within the range of expectations and represents clear and significant loosening from the previous week, which makes sense given the rebound in production,” Bespoke Weather Services said of the 99 Bcf withdrawal. “This number confirms that colder weather will be necessary through February to bounce prices, otherwise there could be further downside.”
After EIA’s report the market “bounced right off the $2.85 support level we highlighted this morning, and the strip appears modestly supportive, so any afternoon gas-weighted degree day additions could support prices. Still, no sizable bounces will come without far colder weather.”
Total working gas in underground storage stood at 2,197 Bcf as of Jan. 26, versus 2,723 Bcf a year ago and a five-year average 2,622 Bcf, according to EIA. The current year-on-year deficit increased week/week from -519 Bcf to -526 Bcf, while the year-on-five-year deficit shrank from -486 Bcf to -425 Bcf, EIA data show.
By region, the largest withdrawals came in the Midwest (-38 Bcf) and East (-30 Bcf). The South Central saw a net 10 Bcf withdrawal, based on 28 Bcf pulled from nonsalt, offsetting an 18 Bcf injection for salt. In the Pacific, 13 Bcf was withdrawn, while 8 Bcf was withdrawn in the Mountain region, according to EIA.
© 2024 Natural Gas Intelligence. All rights reserved.
ISSN © 1532-1258 | ISSN © 2577-9877 |