Markets | NGI All News Access | NGI Data
Natural Gas Bears on Front Foot in August Bidweek as Supply Overshadowing Demand
With summer heat failing to counterbalance continued supply growth, a bearish finish for the front month futures contract eroded natural gas prices across much of the Lower 48 during August bidweek; NGI’s August Bidweek National Avg. eased 4.0 cents to $1.940/MMBtu.
Confirming widespread observations of looser balances year/year, this month’s bidweek average is down 82 cents versus the August 2018 bidweek average of $2.76.
Evidenced by storage injections that have consistently shrunk the deficit to the five-year average in recent months, demand has struggled to keep pace with supply growth this refill season. With the weather unable to deliver sustained above-normal temperatures for key markets, this set the stage for bears to erase 30 cents of value over a three-week period, pushing the August contract down to a $2.141 expiry. This occurred even as some hot stretches in recent weeks accounted for the first below-average inventory builds of the season.
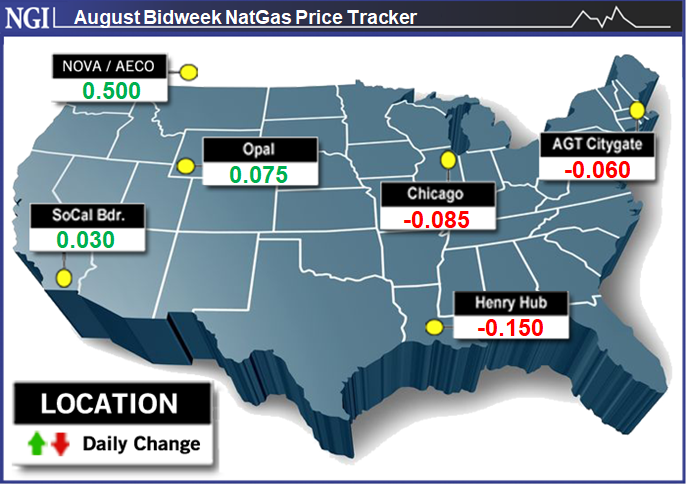
For August bidweek, benchmark Henry Hub sold off 15.0 cents month/month. Locations throughout the Gulf Coast and Southeast posted discounts of a similar magnitude. Transco Zone 4 tumbled 14.5 cents to $2.11, while Houston Ship Channel skidded 20.5 cents lower to $2.13.
Populated markets in the Midwest and East also saw markdowns for August bidweek. Chicago Citygate averaged $2.015, down 8.5 cents month/month, while Transco Zone 6 NY dropped 12.5 cents to $1.95.
Still, despite the pervasive bearish sentiment of late, as bidweek drew to a close, the September futures contract caught a bid. After resistance held around $2.10 earlier in the week, a sharp 9.6-cent rebound followed in Wednesday’s trading. But questions lingered as to how long the rally would last given that the market is running out of summer heat.
“Given the speed and severity of the sell-off that began in mid-July, this correction is not at all surprising,” EBW Analytics Group observed. “…We continue to believe, though, that the rebound…will have only a limited life.”
Earlier in the week, as futures were bottoming out, EBW had observed that “speculator net short positions…are the most bearish since at least 2010.” The month of September “could bring a minefield of bearish catalysts for natural gas, including new Permian supplies, meager weather-driven demand, and potential” liquefied natural gas export shut-ins “dumping excess supplies to be absorbed by the market.”
September formed a double bottom around $2.10 this week with the low in June, and from here prices could “bounce around” in the $2.10-2.45 range, Powerhouse Vice President David Thompson told NGI.
“The fact that we’re talking about gas in the $2.20s after a rally of 10 cents, back the chart out, scroll back and look at the larger time frame” and Wednesday’s gains look a lot less significant, he said.
With the exception of a couple recent Energy Information Administration (EIA) storage reports, injections have outstripped the five-year average for most of the 2019 injection season. However, besides production growth, there could be another factor behind the pace of injections.
The electric grid has grown increasingly reliant on natural gas as a baseload fuel, and this is reshaping seasonal patterns, according to RBN Energy LLC analyst Sheetal Nasta.
While heat “factored heavily” into the swing lower in injections observed in recent reports, “increased baseload demand for gas in the power sector has amplified the effects of weather anomalies and electricity demand seasonality on overall gas demand,” Nasta said. “As a result, gas demand volumes have diverged from historical levels on a temperature-adjusted basis.”
During the 2019 injection season, storage builds have exceeded model projections (based on historical averages) on both an absolute basis and a temperature-adjusted basis, particularly in April, when Nasta said injections spiked to an average of around 8 Bcf/d above the historical model after adjusting for temperatures.
“The higher injections on a per-degree basis compared to recent years signaled a fundamental shift beyond just the effects of weather,” Nasta said. “In particular, domestic consumption was especially weak compared with the prior months, and not just due to the balmy weather but also on a temperature-adjusted basis. Among the demand sectors, this was especially true for gas demand for power generation.”
With gas now enjoying a larger role in the power stack, the natural gas and electricity demand curves have become more closely aligned, a trend that showed up clearly during the spring shoulder season, according to the analyst. Electricity demand typically bottoms out when national average temperatures hit around 60 degrees, she said, whereas gas demand has typically reached its low point at temperatures around 70 degrees.
The closer alignment of the two demand curves “has lowered the temperature at which total natural gas demand bottoms out (and injections increase),” Nasta said. It has also “made the gas market increasingly sensitive to minute swings in electricity generation demand, and by association, weather…following this logic, when electricity demand drops to its seasonal low, we would expect it to take a bigger bite out of power burn than it did historically, and, on the other hand, when electricity demand peaks, we would expect power burn to see a bigger increase than in the past.
“The upshot of all that is, considering the increased gas market share of electricity demand, power burn this spring likely would have moderated somewhat earlier than it has historically, even if weather had come in near normal. But throw in the mix the extremely warm weather in April, and it was a recipe for much weaker demand, not just from res/comm but power burn as well, which then resulted in exceptionally strong gas storage injections.”
Meanwhile, those hoping for production to peak and offer some relief to an oversupplied market may have to wait a while longer.
Genscape Inc.’s latest production estimates showed Lower 48 supply reaching a new daily high this week, topping the 90 Bcf/d mark for the first time since Hurricane Barry crashed into the Gulf Coast last month.
“Our Daily Pipe Production estimate shows volumes cracked the 90 Bcf/d mark” on Saturday (July 27), then on Wednesday volumes “reached 90.89 Bcf/d,” senior natural gas analyst Rick Margolin said.
Thursday’s estimate, potentially impacted by noise associated with first-of-the-month nominations, was back below 90 Bcf/d.
“Comparing the most recent seven days of production to June averages, we see the largest growth has been taking place in Texas (up 0.86 Bcf/d), the East (up 0.78 Bcf/d), the Permian (up 0.27 Bcf/d), Gulf Coast (up 0.18 Bcf/d) and Bakken (up 0.12 Bcf/d),” Margolin said. “The only region to post notable declines recently compared to June has been the Rockies (excluding the Bakken), where production is averaging about 0.34 Bcf/d lower than June. The bulk of these declines are posting in the Denver-Julesburg.”
Genscape is forecasting production to continue to grow “well into next year.”
“We expect recent rates of growth to continue unabated through October, then slowing slightly headed into 4Q2019,” Margolin said.
In the nearer-term, an explosion on the Texas Eastern Transmission (Tetco) system in Kentucky, which reportedly killed one person, grabbed the market’s attention early Thursday as it raised the prospect of restricted supply flowing southbound into the Gulf Coast region.
As images of the blaze were spreading over social media, Tetco declared a force majeure because of an “unplanned outage” on its 30-inch diameter line south of the Danville Kentucky Compressor Station. It notified shippers that north-to-south capacity through the area would be cut to zero. The pipeline said “efforts to restore this line to full capacity are underway” but did not provide any estimates on how long repairs will take.
The news of the explosion appeared to have a bullish effect on futures prices, but that was quickly blunted by a weekly storage injection that exceeded most expectations.
EIA reported a 65 Bcf injection for the week ended July 26, compared to a 31 Bcf injection recorded in the year-ago period and a five-year average of 37 Bcf.
As the figure crossed trading screens at 10:30 a.m. ET, the front month quickly shed over a nickel, dipping from around $2.300-2.310 down to $2.240-2.250 over the next 10 minutes. By 11 a.m. ET, September was trading at $2.236, roughly flat with Wednesday’s settle but down around 7 cents from the pre-report trade.
Prior to Thursday’s report, estimates had been pointing to a build in the mid to upper 50s Bcf.
The bearish miss confirms that balances remain loose versus the five-year average, Bespoke Weather Services said.
“The miss was mostly in the South Central region, and likely stems from record lows across Texas and many other southern locations having more of an impact than we accounted for in terms of gas usage,” Bespoke said. “Next week’s report will likely be tighter than this week’s, but overall, balances continue to underwhelm.”
© 2024 Natural Gas Intelligence. All rights reserved.
ISSN © 1532-1258 | ISSN © 2577-9877 |