NatGas System Methane Emissions Declined in 2012, EPA Says
Methane (CH4) emissions from natural gas systems in the United States totaled 127.1 million metric tons of carbon dioxide (CO2) equivalent (COe) in 2012, a 2.4% decrease compared with 130.3 million metric tons in 2011 and a 16.9% decrease compared with 1990 emissions, according to the U.S. Environmental Protection Agency (EPA).
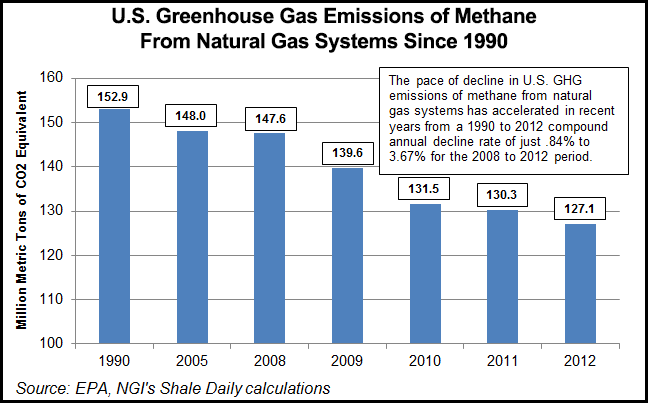
The reduction was credited to a large decrease in emissions from natural gas production and distribution.
“The decrease in production emissions is due to increased voluntary reductions from activities such as replacing high bleed pneumatic devices, regulatory reductions and the increased use of plunger lifts for liquids unloading,” EPA said in its 529-page Draft Inventory Of U.S. Greenhouse Gas Emissions and Sinks: 1990-2012, which was released Monday. “The decrease in distribution emissions is due to a decrease in cast iron and unprotected steel pipelines.”
EPA also found that CH4 emissions from natural gas systems field production were down 25.6% in 2012 compared with 1990, but the trend over that period was not stable. Field production emissions increased 24.9% through 2006 “due primarily to increases in hydraulically fractured well completions and workovers,” but then declined by 40.4% from 2006 to 2012 due to “an increase in plunger lift use for liquids unloading, increased voluntary reductions over that time period (including those associated with pneumatic devices), and RECs [reduced emissions completions] use for well completions and workovers with hydraulic fracturing.” Carbon dioxide emissions from field production increased 39.5% from 1990 to 2012 due to increases in onshore and offshore flaring.
In its previous emissions inventory, released last April, EPA estimated nationwide methane emissions from natural gas systems in 2013 at 143.6 million metric tons of COe (see Daily GPI, April 17, 2013).
Total U.S. greenhouse gas (GHG) emissions (including CH4, CO2 and nitrous oxide) were also on the decline in 2012, down 3.3% compared with 2011, but still 4.4% higher than in 1990.
“The decrease from 2011 to 2012 was due to a decrease in the carbon intensity of fuels consumed by power producers to generate electricity, due to a decrease in the price of natural gas, a decrease in transportation sector emissions attributed to a small increase in fuel efficiency across different transportation modes and limited new demand for passenger transportation, and much warmer winter conditions resulting in a decreased demand for heating fuel in the residential and commercial sectors,” EPA said.
Energy-related activities, primarily fossil fuel combustion, accounted for the vast majority of U.S. CO2 emissions during the study period, and energy related emissions sources accounted for a combined 84.4% of total U.S. GHG emissions in 2012, EPA said.
CH4 and GHG emissions studies in the past have been a source of controversy. Earlier this month a group of researchers said their review of 20 years of technical literature on natural gas emissions in the United States and Canada found that CH4 emissions appear significantly larger than official estimates — possibly 50% more than previous EPA estimates (see Daily GPI, Feb. 14). In 2013, critics said an energy industry-backed study of methane emissions at well sites relied on a too-small sample that was selected by industry participants where “best practices” emissions reductions were already in place (see Shale Daily, Sept. 18, 2013).
© 2024 Natural Gas Intelligence. All rights reserved.
ISSN © 2577-9877 | ISSN © 2158-8023 |