NGI Archives | NGI All News Access
NatGas Production to Remain Near Current Level This Year, Analyst Says
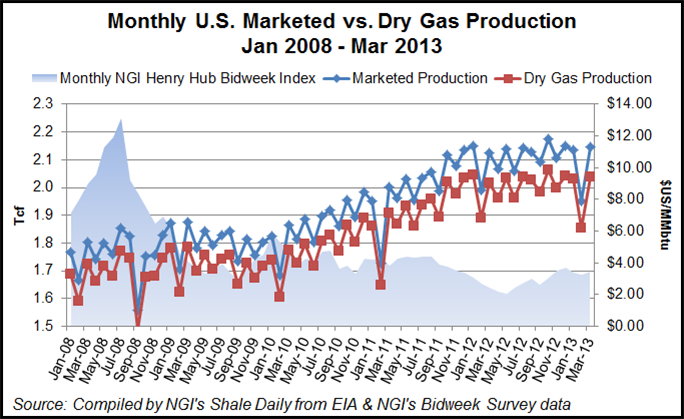
The horizontal natural gas drilling boom drove a long production growth period, but that boom topped out in September 2011, and overall monthly production has remained basically flat since then, analysts at Stephen Smith Energy Associates said in their most recent Monthly Energy Outlook. And while the number of horizontal gas rigs has fallen about 70% from its peak, several effects have worked to maintain the 18-month production plateau, they said.
“First, oil-directed drilling surged as gas-directed drilling collapsed, and some oil plays also produce significant gas. Second, there were substantial infrastructural lag effects, which had the effect of deferring initial gas production until well after the horizontal gas drilling boom had eased. These effects included wells drilled but waiting on fracking [hydraulic fracturing], delayed well hook-ups, construction of gathering lines and larger pipeline expansions, particularly for the Marcellus play.”
The analysts said they expect production to remain at about the current plateau for the rest of this year, with a gradual ramp up in 2014.
A domestic gas storage surplus of 463 Bcf on Feb. 15 had tumbled to a 32 Bcf deficit by May 24, a 495 Bcf decline that “ranks among the strongest we have seen, and oddly, the timing was in the late winter and early spring,” the Smith analysts said.
Such a decline would typically come over the course of a very cold winter, but that wasn’t the case this year. A 5.4% total degree days (TDD) overage that occurred during the 14-week period might explain as much as 200 Bcf of the of the storage surplus decline, and lower-than-normal nuclear generation could account for another 30-40 Bcf. That leaves at least 250 Bcf of the unexplained balance due to much-stronger-than- normal gas-fired generation, the analysts said. And relatively low natural gas prices are at the root of it all.
“The 2013 average gas price for the target 14-week period was $3.91/MMBtu, which was high as compared with $2.22/MMBtu for the corresponding 14-week period of 2012. But the key price comparison to explain deviations from 2006-2010 storage norms is not ‘year-ago prices’ but rather the $6.48/MMBtu average gas price for this 14-week period over the five years 2006-2010.
“In addition to price effects, there has also been a gradual non-price-driven shift from coal-fired to gas-fired generation for more than over a decade.” Prices in the 2006-2010 14-week base period had tended to favor coal generation at the expense of natural gas; during the 2013 period, the gas price “appeared to be an enormous discount,” the analysts said.
In January and February, bidweek prices in the $3.25-3.50/MMBtu range allowed a 10-12% gas-share premium relative to five-year monthly gas-to-gas+coal norms, and there are indications that $4-plus natural gas prices are likely to push that range down to 8-9% this summer.
Analysts at Smith’s and several other firms this spring have raised their price forecasts through the rest of 2013 (see Shale Daily, April 11; April 9; April 4). The reasons cited by those analysts include the cold end to the 2012-2013 winter and EIA Form 914 data indicating declining production. Analyst price predictions for 2013 have run as high as $4.11/MMBtu in a bull-case forecast.
© 2024 Natural Gas Intelligence. All rights reserved.
ISSN © 2577-9877 | ISSN © 2158-8023 |
