Markets | NGI All News Access | NGI Data
NatGas Market’s Black Friday Discount Undercuts December Bidweek Prices
Natural gas bidweek traders could be forgiven for feeling some buyer’s remorse on Cyber Monday, as just days after they locked in deals for December delivery, milder forecasts over the Thanksgiving holiday lent a decidedly more bearish outlook to winter pricing. NGI’s December Bidweek National Avg. finished at $2.825/MMBtu.
December bidweek prices on the whole averaged 45.0 cents higher month/month, but the $2.825 national average stands miles apart from year-ago pricing, when a storage deficit and early season cold sent the December 2018 bidweek average soaring to $5.140.
The sub-$3 December 2019 average reflects a commodity under pressure from continued production growth (helping erase the aforementioned storage deficit) and winter weather that has failed to deliver to this point in the season.
In fact, the biggest Black Friday discount may have been in the natural gas futures market; just days after the December contract rolled off the board at $2.470, January Nymex futures dropped a whopping 22.0 cents to settle at $2.281.
Prices plunged as “forecasts are calling for a mild December amid surging production that continues to hit new highs,” analysts at Tudor, Pickering, Holt & Co. (TPH) wrote in a note to clients Monday. “An early cold snap in October lifted demand and spooked shorts, causing gas to skyrocket to a peak of $2.86 on Nov. 5. However, fundamentals appear to be catching up with the market.”
Last week’s Energy Information Administration (EIA) storage report, which showed a net 28 Bcf withdrawal for the week ending Nov. 22, “points to an oversupply of 2.5 Bcf/d,” according to TPH.
Combined with evidence of continued supply growth, this has “caused prices to complete the round trip. This week’s print isn’t likely to help, as our early modeling points to a roughly 20 Bcf draw, compared to norms of around 50 Bcf. Given the oversupply we expect below-normal draws to continue, with inventories exiting winter materially above the five-year average.”
The TPH analysts said pricing could drop below $2 this spring “to force production out of the market, especially in the Haynesville Shale, where the rig count is still hovering in the mid-50s.”
Coming off a dire performance for January futures over the holiday weekend, analysts at EBW Analytics Group described a “bleak” outlook for the commodity.
“When last week began, many gas traders were hoping for an upside breakout” based partly on the prospect of “sustained cold weather” taking hold for the first two to three weeks of December, the EBW analysts said. “While we disagreed with this forecast and predicted prices would head lower, the bearish shift was more violent than we expected.”
Based on EBW’s “most likely weather scenario” through the end of March, the Nymex forward curve ended last week “reasonably priced.” The firm said it expects end-March inventories just below 1.5 Tcf.
“Over the next 30 days, however, gas prices are not likely to remain stagnant at this level,” EBW analysts said. “Instead, if our current forecast for an extended period of much warmer-than-normal weather validates, natural gas cash market demand is likely to remain weak during most of December, and the year/year storage surplus could reach 650 Bcf or higher. As this occurs, downward price pressure is likely to continue to mount, pushing the January contract to $2.09 or lower.”
On Friday both the American and European models “agreed on a transition into a warmer regime” for the middle third of December, according to Bespoke Weather Services. The American model “backed away from this” heading into Monday’s trading, coming in “considerably colder than what it showed the other day, and closer to the long-term normal for the next 15 days as a whole.”
Conversely, in its latest run ahead of Monday’s session the European model came in “even warmer than it was back on Friday,” Bespoke said. “The main difference lies in the Pacific side of the pattern,” as the American model “no longer shows a trough over Alaska out in the 11-15 day time frame, which allows some colder air back into the pattern across the U.S.”
The forecaster said it’s possible cold returns later in December, but “we do not believe” the American dataset “is correct here and now, as our forecast is closer to the warmer” European model.
Looking at the supply picture, Lower 48 production “ran strong” over the Thanksgiving holiday, averaging 94.27 Bcf/d since Thursday and setting a new daily record high at 94.71 Bcf/d on Saturday, according to estimates from Genscape Inc.
But even with production and milder weather keeping the pressure on prices for now, there are glimmers of hope on the horizon for bulls.
For starters, in terms of Lower 48 output “December could be the last month of growth for a while,” Genscape senior natural gas analyst Rick Margolin said. “…Growth in the Permian, Rockies and Gulf of Mexico is expected to just barely outpace the anticipated turning-over of production in the East, as well as a continuation of declines in the Midcontinent.”
Production volumes from the East “may already be in decline. Ohio production topped out back in early September; West Virginia peaked in late October; Southwest Pennsylvania peaked in early November; and Northeast Pennsylvania production might have peaked two weeks ago.”
The slowdown in the Northeast jives with a recent NGI analysis that showed publicly-traded Appalachian producers as a group are budgeting for a roughly 20% reduction in capital spending in 2020.
“Eventually, those staggering growth rates were going to have to come down anyway, if for no other reason than because of the law of large numbers,” said NGI’s Patrick Rau, director of strategy and research.
What’s more, while growth in supply has grabbed the market’s attention recently, demand has been on the rise as well. U.S. exports, including via liquefied natural gas (LNG) and via pipeline to Mexico, are up 3.4 Bcf/d year/year, according to Genscape. As of last week, the firm’s estimates showed aggregate U.S. exports averaging 12.28 Bcf/d over the past 30 days.
Margolin attributed the year/year increase to LNG trains coming online since last year, as well as the start-up of the Sur de Texas-Tuxpan pipeline delivering gas from South Texas into Mexico.
“The bulk of the aggregate gains are from the LNG space,” Margolin said.
According to NGI’s LNG Insight, total feed gas deliveries to U.S. LNG export terminals came in at just under 7.80 million Dth/d for Monday, and deliveries have topped the 7 million Dth/d mark each day since last Wednesday.
That number should continue to grow longer-term. RBN Energy LLC expects U.S. liquefaction capacity to approach 12 Bcf/d by 2024, nearly double what it is today.
“Most important from a U.S. demand perspective is that, with the exception of maintenance- or hurricane-related outages, this capacity has been and will likely continue to be utilized in a baseload manner — that is, at consistently high rates with little responsiveness to price dynamics,” RBN consultant Katharine Fraser wrote in a recent blog post.
Fraser noted that the growth in U.S. LNG exports has occurred “even as global oversupply conditions have worsened and international prices have come down in the past year or so.”
Partly this is a result of longer-term planning among U.S. offtakers that makes it harder to respond to short-term price shifts, Fraser said. But the bigger reason is that U.S. liquefaction capacity is underpinned by long-term sales and purchase agreements.
These agreements “obligate offtakers to take cargoes regardless of international price spreads, although price spreads still will influence where the cargoes end up,” she said. “Thus, on the whole, it is likely that most U.S. LNG terminals will flow at or near capacity most of the time. In other words, like baseload.”
Combined with higher baseload power demand, this increases the daily call on natural gas supplies, thus increasing the potential for volatility.
“With that bigger base comes heightened price sensitivity any time demand jumps,” Fraser said. “During periods of extremely cold weather, for example, it is likely that additional demand will tighten the market significantly, resulting in price spikes.”
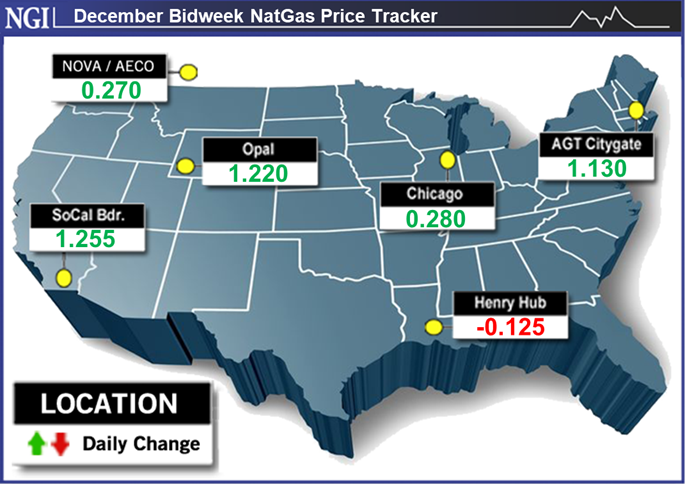
The price spikes in December bidweek trading were confined to the coasts. Through the middle third of the Lower 48, after averaging fixed and basis trades most hubs ended bidweek in the mid-$2s range. Henry Hub shed 12.5 cents month/month to average $2.470.
Meanwhile, chilly temperatures and wintry precipitation to close out November helped strengthen prices throughout the Rockies, California and Desert Southwest in December bidweek. Gains were especially pronounced at SoCal Citygate and Northwest Sumas, which both soared above $6.
In the case of Northwest Sumas, the bidweek increase occurred even as Westcoast Energy Inc. is advancing its plans to return service through its T-South segment following an October 2018 rupture near Prince George, British Columbia. The resulting supply disruptions helped drive spot prices at Northwest Sumas to a record-high $200 in March.
Westcoast said in a notice Friday that it was “in the process of bringing all remaining pipe segments back safely to normal operating pressure” and that it planned to bring capacity through its Station 4B South to 1,820 MMcf/d starting Sunday.
Genscape analyst Joe Bernardi recently pointed to strong demand in the Pacific Northwest and lower-than-usual stocks at the Jackson Prairie storage facility as contributing factors to the strength at Northwest Sumas.
As of Monday Pacific Northwest demand, including Idaho, Oregon and Washington, had averaged 4.93 Bcf/d over the past 30 days, up nearly 0.5 Bcf/d from the year-ago period, according to Genscape.
As for SoCal Citygate, chilly temperatures and tight conditions on the Southern California Gas (SoCalGas) system prompted the utility to initiate its Aliso Canyon Withdrawal Protocol in late November. In the aftermath of the high-profile 2015 leak, withdrawals from the Aliso facility have generally signaled strained conditions ripe for volatility in Southern California.
SoCalGas appeared likely to face continued upward pressure in the spot market heading into the week, with demand forecast to total around 3.5 million Dth/d over the next several days, well above the projected 2.7-2.8 million Dth/d of receipts.
The strength of prices further downstream appeared to boost the outlook on West Texas prices for December. Bidweek trades at Waha jumped 68.0 cents on average to $1.405.
Over on the East Coast, Northeast hubs, where winter volatility has become the norm, also saw large month/month gains for December bidweek. Algonquin Citygate climbed $1.130 to $5.075, while Iroquois Zone 2 picked up $2.035 to $5.065.
However, much like the broader market, the Northeast premiums for December bidweek reflect a significant decline from year-ago levels. For December 2018, Algonquin Citygate averaged $10.570, while Iroquois Zone 2 averaged $8.370 at the time, NGI’s Bidweek Survey historical data show.
© 2024 Natural Gas Intelligence. All rights reserved.
ISSN © 1532-1258 | ISSN © 2577-9877 |