Markets | NGI All News Access | NGI The Weekly Gas Market Report
NatGas Marketers’ 2014 Downward Spiral Continued in Final Quarter
BP plc extended its dominance over other North American natural gas marketers with a gain in 4Q2014, continuing its trend for the year, but for many other marketers, both the quarter and the full year resulted in declines compared to previous periods.
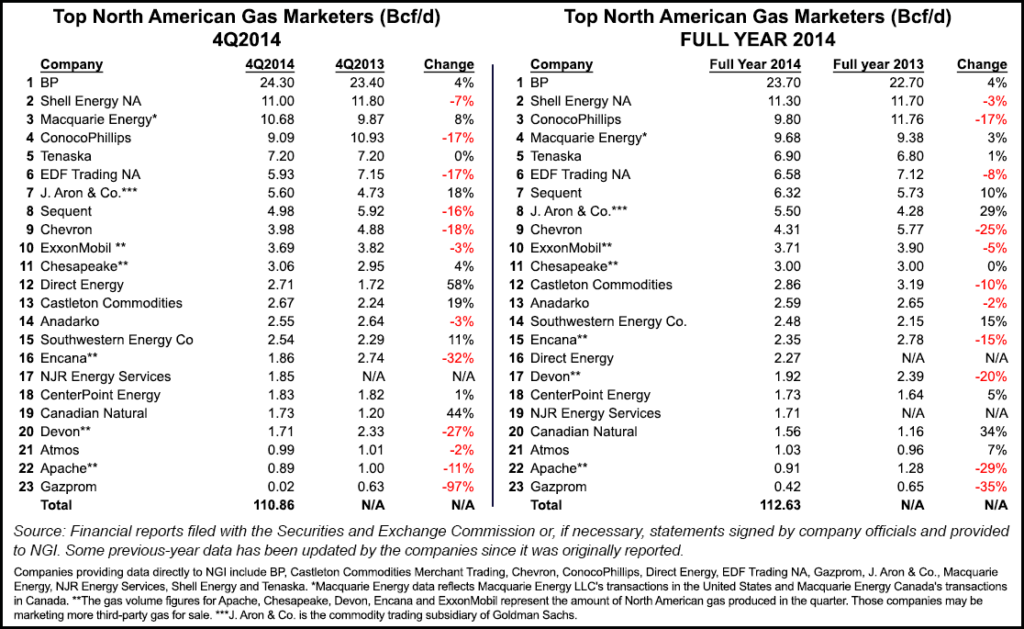
Twenty-two leading gas marketers reported combined sales transactions of 109.01 Bcf/d in NGI‘s 4Q2014 Top North American Gas Marketers Ranking, a 3% decline compared with the 112.27 Bcf/d those same companies reported in 4Q2013. Six of the survey’s top 10 marketers and a dozen companies overall reported lower numbers in 4Q2014 than in the year-ago period.
There were some gainers, however, including several companies recently moving up in the trading ranks: Macquarie Energy, J.Aron & Co., Chesapeake Energy Corp., Direct Energy, Castleton Commodities, Southwestern Energy Co. and NJR Energy Services.
NGI‘s survey of North American marketers has reported only one overall increase in sales compared to a year-ago period in the past 11 quarters, in 1Q2014, when sales by participating companies increased 0.61 Bcf/d (about 0.5%) compared with 1Q2013. Prior to that, the last increase was recorded in 2Q2012, when participating companies sold a total of 135.86 Bcf/d.
Full-year totals reflected that trend in NGI’s Full-Year 2014 Top North American Gas Marketers Ranking, with participating companies reporting a combined 2% decline compared to 2013. Still, the falloff wasn’t as great as a year ago, when 2013 sales totals came in 8% below 2012 totals (see Daily GPI, March 14, 2014).
Two big contributors to the continuous decline in marketed gas volumes are the huge gap between oil and gas prices in recent quarters, along with a general decline in natural gas price volatility since gas prices peaked several years ago, according to Patrick Rau, NGI‘s director of Strategy & Research.
“The exploration and production business will always be a margin business, and cash flow needs for most companies means they will focus on their highest margin areas, especially in the short-term. Until recently, that meant focusing on oil and liquids rich areas, oftentimes at the expense of dry gas production,” Rau said.
It also doesn’t help that many natural gas fields simply aren’t economic at today’s prices. The economics of most U.S. natural gas plays, wet or dry, are below breakeven levels after suffering as a result of the decline in commodity prices, according to a recent Barclays Capital analysis (see Shale Daily, March 12). With many drilling opportunities not able to make money at today’s commodity prices, there’s a “shrinking opportunity set,” the analysts said.
But things may be looking up for natural gas volumes over the next few quarters. “With the precipitous fall in crude prices in recent months, momentum may be swinging back in favor of natural gas, at least on a relative basis,” Rau noted.
According to Baker Hughes Inc. data, the gas-focused rig count in the United States is down on an absolute basis in recent months, but today it accounts for approximately 23% of rigs at work in the United States, up from roughly 17% last summer, before crude prices began to crater.
Rau also said several industry pundits expect some significant coal-to-gas power generation switching later this summer, and that seems to be supported by current coal and natural gas futures curves.
“That would certainly help gas volumes later this year, everything else being equal. Not to mention more coal fired plants are scheduled to be retired this year, and expected increases in industrial demand could help pick up the slack as well,” Rau said.
Still another factor behind the slowing gas volumes in recent times may simply be a function of how companies choose to report their production figures.
“Drilling in wet gas areas has been all the rage in the United States the last few years,” Rau said. “Many companies had been reporting their natural gas liquids [NGL] volumes as natural gas production, but now more are taking care to report those volumes separately. If these NGLs are no longer being counted as natural gas volumes, that may explain some of the falloff in marketed volumes right there.”
Perennial survey No. 1 BP reported 24.30 Bcf/d in 4Q2014, a 4% increase compared with 23.40 Bcf/d in 4Q2013. The London-based major, which began restructuring its global businesses following the Macondo well blowout in 2010, has been forced into more belt-tightening by the recent blowout in oil prices (see Daily GPI, Feb. 3; Jan. 26; Dec. 10, 2014). BP, which expects to incur $1 billion in nonoperating restructuring charges through 4Q2015, recently cut 2015 capital expenditures to $20 billion from an original plan of $23-26 billion, and it has announced cuts to its workforce and freezes in pay.
Shell Energy NA reported 11.00 Bcf/d in 4Q2014, a 7% decline compared with 11.80 Bcf/d in 4Q2013. Royal Dutch Shell plc last month said it may cancel up to 40 projects over the next three years, worth an estimated $15 billion, including some in North America, but it hasn’t cut spending from 2014 levels (see Daily GPI, Jan. 29a). The deepwater Gulf of Mexico remains a priority, as does preparation for a possible $1 billion summer drilling program in Alaska’s offshore, company officials said.
The largest decline for the seventh consecutive month came at ConocoPhillips, which reported 9.09 Bcf/d, down 1.84 Bcf/d (17%) from 10.93 Bcf/d in 4Q2013. Such double-digit declines, which ConocoPhillips first reported in NGI‘s 1Q2013 survey, are primarily because of the implementation of business model restructuring in North America following the spin-off of downstream operations in 2012 (see Daily GPI, April 17, 2012) and the company’s view of market conditions.
ConocoPhillips year-over-year (y/y) production from continuing operations, excluding Libya, grew 4% in 2014, fueled by growth from major projects, development programs and a 35% y/y increase in combined production from the Eagle Ford and Bakken shales — but the Houston-based major’s earnings were down for both 4Q2014 and the full-year 2014 (see Daily GPI, Jan. 29b; Shale Daily, Dec. 8, 2014). It recently slashed $2 billion from its capital expenditures budget for 2015 — from $13.5 billion to $11.5 billion — citing the collapse in world crude oil prices.
Other notable decreases compared with 4Q2013 were reported by EDF Trading (5.93 Bcf/d, down 17%), Sequent (4.98 Bcf/d, down 16%), Chevron (3.98 Bcf/d, down 18%), ExxonMobil Corp. (3.69 Bcf/d, down 3%), Anadarko Petroleum Corp. (2.55 Bcf, down 3%) and Encana Corp. (1.86 Bcf/d, down 32%).
But there were upturns compared with the year ago period, too. Macquarie Energy moved into the third slot in the survey with 10.68 Bcf/d in 4Q2014, an 8% increase compared with 9.87 Bcf/d in 4Q2013. Other companies reporting increases included J.Aron & Co. (5.60 Bcf/d, up 18%), Chesapeake Energy Corp. (3.06 Bcf/d, up 4%), Direct Energy (2.71 Bcf/d, up 58%), Castleton Commodities (2.67 Bcf/d, up 19%) and Southwestern Energy Co. (2.54 Bcf/d, up 11%).
Joining NGI’s survey of leading traders for the first time is NJR Energy Services, a subsidiary of New Jersey Resources, which reported 1.85 Bcf/d in 4Q2014. NJR provides unregulated wholesale natural gas to industrial customers across the East, West and Gulf coasts and Canada.
Longtime participant BOA Merrill Lynch left the survey this quarter in what a spokesman characterized as “a business decision based on the current size of the physical gas portfolio as it relates to the total commodities business.” The company reported 0.74 Bcf/d in 4Q2013, a 41% decline from a year earlier, and 0.64 Bcf/d in 3Q2014, a 24% decline compared with 3Q2013 (see Daily GPI, Dec. 12, 2014).
In NGI‘s Full-Year 2014 Top North American Gas Marketers Ranking, BP also pulled away from the pack, reporting 23.70 Bcf/d, up 5% compared with 2013. Rounding out the top five in the survey, Shell reported 11.30 Bcf/d, down 3% compared with the previous year; ConocoPhillips 9.80 Bcf/d, down 17%; Macquarie 9.68 Bcf/d, up 3%, and Tenaska Marketing Ventures 6.90 Bcf/d, up 1%.
Highlights of the full-year survey include a 10% increase for Sequent (6.32 Bcf/d, compared with 5.73 Bcf/d in 2013), a 29% increase for J. Aron (5.50 Bcf/d, compared with 4.28 Bcf/d in 2013), a 15% increase for Southwestern (2.48 Bcf/d, compared with 2.15 Bcf/d in 2013), a 5% increase for Centerpoint Energy (1.73 Bcf/d, compared with 1.64 Bcf/d in 2013), a 34% increase for Canadian Natural Resources (1.56 Bcf/d, compared with 1.16 Bcf/d in 2013), and a 7% increase for Atmos (1.03 Bcf/d, compared with 0.96 Bcf/d in 2013).
In addition to BOA Merrill Lynch, two other marketers — JPMorgan and Gavilon LLC — fell by the wayside in 2014. JPMorgan completed the sale of its physical commodities business to Mercuria Energy Group Ltd. in early October (see Daily GPI, March 19, 2014). Privately held Mercuria does not release sales data, but claims to be one of the largest integrated energy and commodity trading companies in the world (see Daily GPI, June 4, 2009). In early 2014, Gavilon and Tenaska jointly applied for waivers from FERC to allow completion of a deal selling Gavilon’s wholesale gas marketing business, including transportation and storage contracts, to Tenaska (see Daily GPI, Feb. 26, 2014).
Joining the survey during 2014 was Direct Energy, which acquired Hess Corp.’s New Jersey-based energy marketing business in 2013 (see Daily GPI, July 31, 2013). With plans to sell its energy marketing unit looming, Hess slipped out of NGI‘s ranking in 1Q2013 (see Daily GPI, June 10, 2013). Hess had been reporting significantly lower numbers than the latest from Direct Energy, which report 2.27 Bcf/d for the full year 2014.
The NGI survey ranks marketers on sales transactions only. The Federal Energy Regulatory Commission tallies both purchases and sales. FERC’s combined buy/sell volumes were 118,099 TBtu in 2013, down 4.7% from the prior year, according to an analysis by NGI of 2013 Form 552 buyer and seller filings (see Daily GPI, June 5, 2014). Purchase and sales volumes cannot be compared with production because a single package of gas may be sold several times between the wellhead and the burnertip.
© 2024 Natural Gas Intelligence. All rights reserved.
ISSN © 1532-1231 | ISSN © 2577-9877 | ISSN © 1532-1266 |