NatGas Forwards Prices Lose Steam Amid Bearish Weather, Producer Selling
June natural gas forward prices fell an average 8 cents from April 28 to May 2 as bearish near-term weather and producer selling pressured the markets, according to NGI Forward Look.
Declines were seen across the forward curves, with July forward prices dropping an average 7 cents, balance of summer (July-October) forward prices sliding 7 cents and winter 2017-2018 forward prices falling 8 cents, Forward Look data shows.
The weakness across the curves essentially mirrored that of Nymex futures, which set the tone for the week on Monday as each month through the winter 2017-2018 shed around 6 cents. Smaller losses were seen beyond that, leading to a steeper backwardation in the futures curve.
In recent months, this dynamic has been in play when large volumes of producer selling hits the market, analysts with Mobius Risk Group said late Monday.
“The price path on Tuesday and Wednesday will be telling, as a rebound would support the theory of heavy producer selling having been digested by the market. Conversely, if there is downside follow through, the market could be responding to less than bullish weather conditions along the Gulf Coast,” the Houston-based company said.
Incidentally, Tuesday trading brought about additional downside as the Nymex ended the day a couple of cents lower, but Wednesday was set for a modest technical rebound as the June futures contract ultimately settled 3.3 cents higher at $3.228. Some strength is typical the day before the U.S. Energy Information Administration releases its weekly storage report.
For the entire April 28 to May 2 period, the Nymex June futures contract lost 8 cents to settle at $3.195, the July futures contract shed 8 cents to reach $3.27, the balance of summer (July-October) futures strip dropped 8 cents to $3.29 and the winter 2017-2018 fell 7 cents to $3.47.
Going forward, Mobius said it expects the average weekly injection from May through mid-June to be a key barometer for market strength/weakness. The Desk Early View survey for Thursday’s storage report showed an average 61 Bcf injection from a sample of 11 traders. Last year, 68 Bcf was injected, but the five-year average comes in at 63 Bcf. The range on the survey was from 54 to 74 Bcf.
Mother Nature appears to be throwing the gas markets a bone as opposing weather systems in the eastern and west-central United States drive stronger-than-normal demand. With cooler-than-normal conditions expected to hold over much of the central and eastern United States late next week through the following weekend (May 9-14), the next four EIA weekly storage reports are expected to come in under five-year averages, according to forecaster NatGasWeather. Surpluses are likely to decrease by around -10-25 Bcf in each of the following three EIA reports.
“It seems bulls lost momentum the past few days with prices selling off in the face of cooler weather trends and a little stronger demand and thus would need to reclaim $3.23. Although, there are other important factors, such as production, export and power burn trends,” NatGasWeather said.
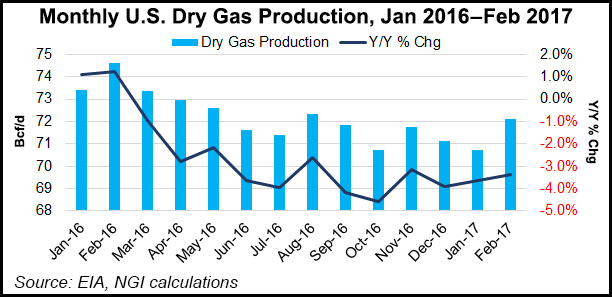
While production remains lower year/year, monthly U.S. dry production hit 72 Bcf/d in February, up nearly 1.4 Bcf/d from January. And even though maintenance issues and mild shoulder-season demand has current production levels hovering around 70 Bcf/d, significant growth is expected in the second half of the year.
The big question mark facing the market right now is summer demand, NGI’s Patrick Rau, director of strategy and research, said. “Who knows for sure what the weather will actually be, and what impact that will have on the storage levels relative to the historical five-year average,” he said.
The five-year average itself is actually throwing a monkey wrench into evaluating storage volumes, Rau said. The reason is that with the growth in gas fired electric generation the last few years, and the advent of U.S. liquefied natural gas exports (LNG), the five-year average isn’t and will not be as useful a benchmark until probably sometime well after 2020.
For example, gas delivered to U.S. power customers between June and September in the last five years has averaged 30.1 Bcf/d. Those totals grew to 31.8 Bcf/d and 34.3 Bcf/d in the last two years, however, thanks to increased gas-fired generation capacity.

“If you assume a simple repeat of that 34.3 Bcf/d this June through September, that is 4.2 Bcf/d of demand over and above the average for the previous five summers. 4.2 Bcf/d x 122 days = 509 Bcf/d of gas that would be burned over and above the previous five year average, so everything else being equal, that would easily absorb the current 299 Bcf surplus to the five-year average,” Rau said.
That doesn’t even take into account LNG exports and pipeline exports to Mexico, both of which are higher than they were last year. The United States is becoming a de facto storage provider to the rest of the world, so the surplus to the previous five-year average needs to be higher than it has been in previous years, he added.
Therein lies part of the problem. Those who look at the current surplus to the previous five-year average may be a bit more bearish, while those that are adjusting the previous five-year average for the growth in gas-fired generation capacity and exports may see there isn’t enough gas in storage.
This problem will continue until the massive coal-to-gas switching build-out is finished, and all the U.S. liquefaction trains are in place, which won’t happen until 2020. But even then, it will still take five years for the average five-year storage balance to more equally weight all the new capacity, Rau said. “More volatility. Traders should love it,” he said.
Looking a bit closer at the forwards markets, Dominion points continued to move against the pack. Dominion June forward prices rose 1 cent between April 28 and May 2 to reach $2.60, while July slipped 1 cent to $2.655, and the balance of summer held steady at $2.70, Forward Look data shows. This apparent strength is in relation to the weakness seen in most other U.S. forwards markets.
This modest strength is likely attributed to the storage situation at Dominion. Dominion inventories currently stand at 68 Bcf, well below last year’s 114 Bcf inventory for the same reporting week and the five-year average of 103.2 Bcf. The current storage deficit, and resulting injection demand through the summer, are likely supporting the forward curve, but as NGI mentioned last week, production in the Northeast continues to grow at record pace, which could pose downside risk.
Speaking of production, ongoing activity in the Permian Basin, which is largely driven by oil drilling, continues to wreak havoc on Waha gas prices. That’s because as oil production grows in the Permian, so does the associated gas production. And without additional pipeline capacity to bring that gas to market, prices continue to weaken.
Waha June forward prices plunged 13 cents between April 28 and May 2 to reach $2.76, July tumbled 12 cents to $2.94, the balance of summer dropped 10 cents to $2.97 and the winter 2017-2018 slid 9 cents to $3.10, according to Forward Look.
© 2024 Natural Gas Intelligence. All rights reserved.
ISSN © 2577-9915 | ISSN © 2577-9877 |