NGI The Weekly Gas Market Report
NGI The Weekly Gas Market Report | Forward Look | Markets | NGI All News Access
May Natural Gas Forwards Up 30 Cents as Supply/Demand Balances Tighten
An increasingly tight supply/demand picture that began emerging over the past week sent natural gas forwards surging during the April 2-7 period. May prices jumped an average 30 cents, and similarly stout double-digit gains were seen through the remainder of summer, according to NGI’s Forward Look.
Prices for next winter and the following summer also posted solid increases, with the momentum seen across the Lower 48 mirroring the behavior in futures trading over the five-day period. The Nymex strip has been on a tear since last Friday as weather outlooks for April trended colder and production growth started to show signs of slowing.
The May Nymex futures contract settled Tuesday at $1.852, up 30 cents from April 2. The balance of summer (May-October) jumped 23 cents to $2.06, and winter 2020-21 (November-March) climbed 9 cents to $2.69.
Just last Thursday (April 2), May futures touched a low of $1.521 when spot prices faded heading into the weekend, but next week’s cold and the shape of the curve “could keep a strong tailwind behind near-term contracts,” according to Mobius Risk Group.
Weather models have turned increasingly chilly in recent runs, putting April on the colder side of historical norms. The Global Forecast System continued to add a small amount of demand in the overnight run, but then lost it and a bit more by midday Wednesday. The European model also warmed compared to Tuesday, according to NatGasWeather.
The changes in the data were focused on milder trends for late this week into early next week, but still featured “rather chilly/bullish” conditions for April 10-19, “just not quite as impressive.”
Also of important consideration, all U.S. natural gas markets will be closed Friday for the Good Friday/Easter holiday, leaving considerable risk of a gap up or down on the Sunday reopen,” NatGasWeather said.
Meanwhile, production figures are starting to show the impact of such low commodity prices, leading to frequent updates to forecasts. Genscape Inc. noted that daily production prints have been posting notable declines and while the firm can pinpoint “a good portion” of the drops to maintenance in certain regions, some of the declines are likely reactions to the rapid collapse of prices.
“Our top-day estimate of Lower 48 production is showing a more than 1 Bcf/d day/day drop Wednesday, having sunk just below 91 Bcf/d,” Genscape senior natural gas analyst Rick Margolin said. While the estimate is likely to get revised higher in later cycles, “at the moment, it marks the lowest single day of production since early February, when freeze-offs whacked more than 1 Bcf/d offline.”
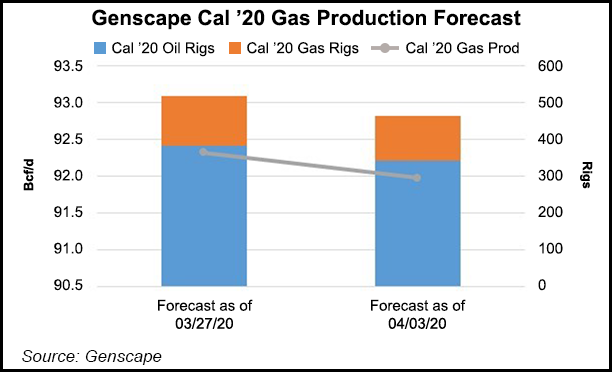
Genscape continues to adjust its production models as rigs have actualized substantially lower than the firm’s price-driven forecast had been guiding. The last two weeks have marked the largest observed percentage decline in rig counts since Genscape/Spring Rock began tracking.
“In our most recent weekly update to our production forecasts, we have further reduced our Calendar 2020 gas production outlook by an additional 0.6 Bcf/d versus our mid-March forecast,” Margolin said. “Cal 2021 has been reduced by more than 1.3 Bcf/d from our last forecast.”
In a note to clients on Wednesday, Tudor, Pickering, Holt & Co. (TPH) said that following Continental Resources Inc.’s recent announcement that it intends to shut in around 30% of production over the next couple of months, it expects others to follow suit in the coming weeks.
Ultimately, the duration of shut-ins likely will be dictated by the shape of demand recovery, and producers likely will have to keep volumes constrained to match refinery run cuts until visibility of a recovery becomes clear, according to TPH. “While Bakken Shale differentials already have started producers down the path of shut-in discussions, we expect the pressure will likely spread in the coming month as storage along the Gulf Coast continues to rapidly fill.”
Even with the potential for supply cuts by the Organization of Petroleum Exporting Countries and its allies on the horizon, the magnitude of the demand decline, which TPH pegs at 20 million b/d, would likely outweigh any near-term supply response, and regional prices may dip toward cash cost to push a growing wedge of U.S. production into a shut-in scenario.
“Ultimately, it remains our view that demand will likely dictate near-term pricing and supply reductions may ultimately have to match run cuts from a refining standpoint as tank tops start to fill,” TPH said. “This, to some degree, will help mitigate part of the pressure on physical storage, but it’s important to note that production for the most part will not be structurally lost and as prices recover, we would expect producers to bring back on volumes, somewhat reversing the steep second quarter supply declines.”
With longer-dated tenors along the Nymex gas futures curve sitting around the $2.40 mark through 2025, producers face the lowest five-year strip in the shale era, according to Mobius. Although the risk factors of weather, Covid-19 and U.S. crude market recovery stand as “wild cards” impacting the balance of the year and 2021 strip, the firm said that natural gas consumers would be wise to consider the prospect of being able to take out winter exposure at less than full-cycle breakevens for most producing basins. Alternatively, collaring exposure with a floor price near $2.00 and ceiling at less than $3.50 could be another attractive solution.
“However, the yin and yang of producer/consumer sentiment has both camps in a conundrum,” Mobius said. “Does the producer accelerate volumetric growth into the peak part of the natural gas curve (2021)? And does the consumer finally get rewarded for looking out to deeper discounts in long-dated tenors?
Another unknown looming over the natural gas market is whether U.S. exports could shut in during the coming months due to the unprecedented slaughtering of demand related to the Covid-19 pandemic. Although China reportedly has granted tax waivers for U.S. liquefied natural gas (LNG) imports and four tankers carrying domestic supplies reportedly were heading for Tianjin, it remained unclear whether the cargoes ultimately would land there as deliveries were expected in late April or early May.
For now and the foreseeable future, the market may be more concerned with whether a breach of 4 Tcf in storage inventories is likely at the end of October or in early November. Last week, the Energy Information Administration (EIA) reported what many market observers deemed the last withdrawal of the winter season.
The EIA said that inventories fell 19 Bcf for the week ending March 27, a draw that left total working gas in storage at 1,986 Bcf, 863 above year-ago levels and 292 Bcf above the year-average of 1,694 Bcf.
This week, analysts are predicting the EIA to report an injection between 9 and 33 Bcf. A Wall Street Journal poll of 12 analysts showed injection estimates averaging 21 Bcf. Respondents to a Bloomberg survey arrived at a similar range, with a median build of 24 Bcf. NGI’s model estimated the injection at a much larger 37 Bcf.
These figures compare with a 25 Bcf increase in storage in the same week last year and the five-year average injection of 6 Bcf, according to EIA. The next weekly storage inventory report is scheduled to be released at 10:30 a.m. ET on Thursday.
From Mobius’ perspective, eyes should first train on Eastern Canadian and Upper Midwest west storage capacity, as those two regions are likely to be the bellwether for how regional prices and, in turn, North American supply may respond to constrained operating conditions.
“Consider that an Appalachian shale well produces at more than twice the rate of an average U.S. shale well. If the market needs a large supply-side correction in a short period of time, that is how it is best achieved,” the firm said.
Western Canadian producers are very familiar with this dynamic as they often are the first supply basin to get crunched when North America is deemed to have ”excess supply’, according to Mobius. “AECO spot prices and forwards have predominantly traded below $2.00 since early 2018, and the result has caused Western Canadian storage levels to dip back to five-year lows.”
Markets from coast to coast mounted hefty gains at the front of the forward curve during the April 2-7 period, largely driven by the tighter supply/demand picture. Stronger cash prices due to strong power burns also have provided some uplift to forward prices across the country.
Markets out West also strengthened, although increases were a little less pronounced amid more widespread use of renewable energy to meet demand. SoCal Citygate May rose 20 cents from April 2-7 to reach 1.814, while the balance of summer picked up 5 cents to hit $2.51. Nex winter also climbed 5 cents to reach $3.76, while prices for next summer were down 4 cents to $2.90, according to Forward Look.
Meanwhile, an El Paso Natural Gas force majeure set to begin April 14 could affect 559 MMcf/d of westbound flow to Arizona and potentially hamper delivered volumes to Southern California Gas, according to Genscape. Pipeline anomalies discovered downstream of its Cimarron compressor station during routine maintenance require a segment of Line 2000 to be isolated, cutting flows through the Tom Mix compressor station in southeast Arizona to zero, from a prior 30-day average of 559 MMcf/d.
Elsewhere throughout the Lower 48, forward curves in the Midcontinent and downstream of the producing region brushed off some pipeline maintenance occurring over the next couple of weeks. Natural Gas Pipeline Co. of America (NGPL) declared a force majeure that went into effect on Wednesday and was set to last through April 18 that would affect flows through Station 105 in Cloud County, KS, and constrain 450 MMcf/d of the entire Amarillo mainline available capacity.
This event falls in between other large-impact tool runs that NGPL began performing on April 1 and are scheduled to last through mid-month, according to Genscape analyst Matthew McDowell. However, “similar events that cut Amarillo mainline capacity have shown that NGPL’s Gulf Coast mainline can compensate for increased market area demand, and Chicago Citygate basis volatility has been muted during recent demand events and supply constrictions due to a diverse supply side.”
Chicago Citygate May prices were up 31 cents from April 2-7, while the balance of summer rose 24 cents to $1.84. Winter climbed 9 cents to $2.72, and next summer moved up 3 cents to $2.23, Forward Look data showed.
© 2024 Natural Gas Intelligence. All rights reserved.
ISSN © 2577-9915 | ISSN © 2577-9877 | ISSN © 1532-1266 |