Markets | E&P | LNG | NGI All News Access | NGI The Weekly Gas Market Report
LNG Exports Surge 241%, Dry NatGas Production Up 1% Year/Year, EIA Says
For the second consecutive month, U.S. dry natural gas production increased year/year (y/y) in July to 2.28 Tcf, a 0.5% increase from July 2016, while liquefied natural gas (LNG) exports have more than doubled, according to the Energy Information Administration (EIA).
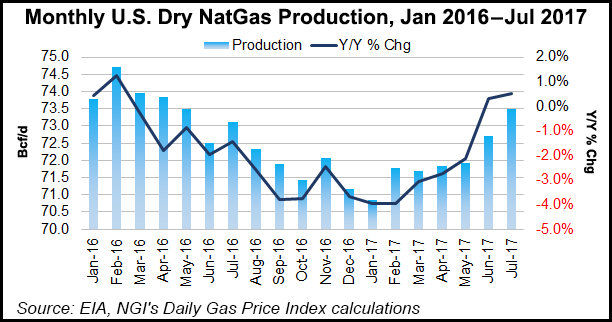
According to the latest EIA’s Natural Gas Monthly report, July’s mark in domestic dry gas production is so far the highest for the year, slightly above the 2.23 Tcf recorded in May and 2.22 Tcf from March. February remained the laggard for the year at 2.01 Tcf. The production mark for July 2017 was the highest since May 2016, which also was 2.28 Tcf.
Marketed production totaled 2.44 Tcf in July, a 4.4% increase from the preceding month (2.34 Tcf) and a 1% increase from the year-ago month (2.42 Tcf). Production estimates are based on data from Form EIA-914, the Monthly Crude Oil, Lease Condensate and Natural Gas Production Report. July’s mark in marketed production was the highest since March 2016 (2.45 Tcf).
The EIA said the most recent July was the second-highest for the month in terms of natural gas consumption at 2.11 Tcf, an 11.7% increase from the preceding month (1.89 Tcf) but 3.7% lower than July 2016. The latter was the highest for the month in terms of natural gas consumption since the EIA began tracking the metric using its current methodology, which it adopted in 2001.
According to the EIA, y/y total consumption of dry natural gas in July increased in three of the four consuming sectors. Residential deliveries increased 1.2% (to 108 Bcf, up from 106 Bcf) while industrial deliveries rose 1.3% (to 624 Bcf, up from 616 Bcf). Commercial deliveries were relatively flat at 134 Bcf. Industrial deliveries were the highest for July since EIA began using the current definitions for consuming sectors introduced in 2001.
The lone consuming sector that saw a decrease in July was electric power deliveries, which declined 7.9% (to 1.05 Tcf, down from 1.14 Tcf).
After three consecutive months where the United States was a net exporter of natural gas, July 2017 saw net imports of 2.1 Bcf. Still, it was a marked improvement from the 76.3 Tcf of net gas imports recorded in July 2016. The bulk of the 250.1 Bcf the United States imported in July 2017 came via pipeline from Canada (245.2 Bcf), while LNG imports from Trinidad & Tobago totaled 4.97 Bcf. Total imports increased 4.8% from the previous month (239.8 Bcf), but declined 5.5% from July 2016 (265 Bcf).
The United States exported 248.4 Bcf in July, a 1.9% decline from the previous month (253.3 Bcf) but a 31.7% increase from July 2016 (188.7 Bcf). LNG exports totaled 53.6 Bcf in July, a 2.2% increase from the preceding month (52.5 Bcf) but a whopping 241% increase from July 2016, when LNG exports totaled just 15.7 Bcf.
Ten countries imported U.S. LNG, via vessel and truck, in July. The largest importer was Mexico via vessel at 14.4 Bcf, but South Korea was a close second at 14.2 Bcf. By comparison, the United States only exported LNG to six countries in July 2016, with Chile taking the most via vessel at 6.1 Bcf. Still, LNG exports to Mexico, which included exports via vessel and truck, declined 41.6% from the preceding month (24.8 Bcf).
Other countries that imported U.S. LNG in July were China (7.2 Bcf), Portugal (3.7 Bcf), Brazil (3.6 Bcf), Egypt (3.5 Bcf), Kuwait (3.4 Bcf), Chile (3.3 Bcf), Spain (217 MMcf) and Barbados (10 MMcf).
© 2024 Natural Gas Intelligence. All rights reserved.
ISSN © 1532-1231 | ISSN © 2577-9877 | ISSN © 1532-1266 |