Markets | NGI All News Access | NGI Data | NGI The Weekly Gas Market Report
Gas Displacing Appalachian Coal; Futures Bulls Fumble Post Storage Data
Gas for delivery Friday sagged in Thursday’s trading as traders scrambled to get deals done ahead of the often hyper-volatile trading induced by the release of government storage figures.
It was a tale of two markets, with weakness across the East more than matching gains everywhere else. Gulf, Great Lakes, Midcontinent, Rockies and California points all posted gains. Overall, the market came out 5 cents lower.
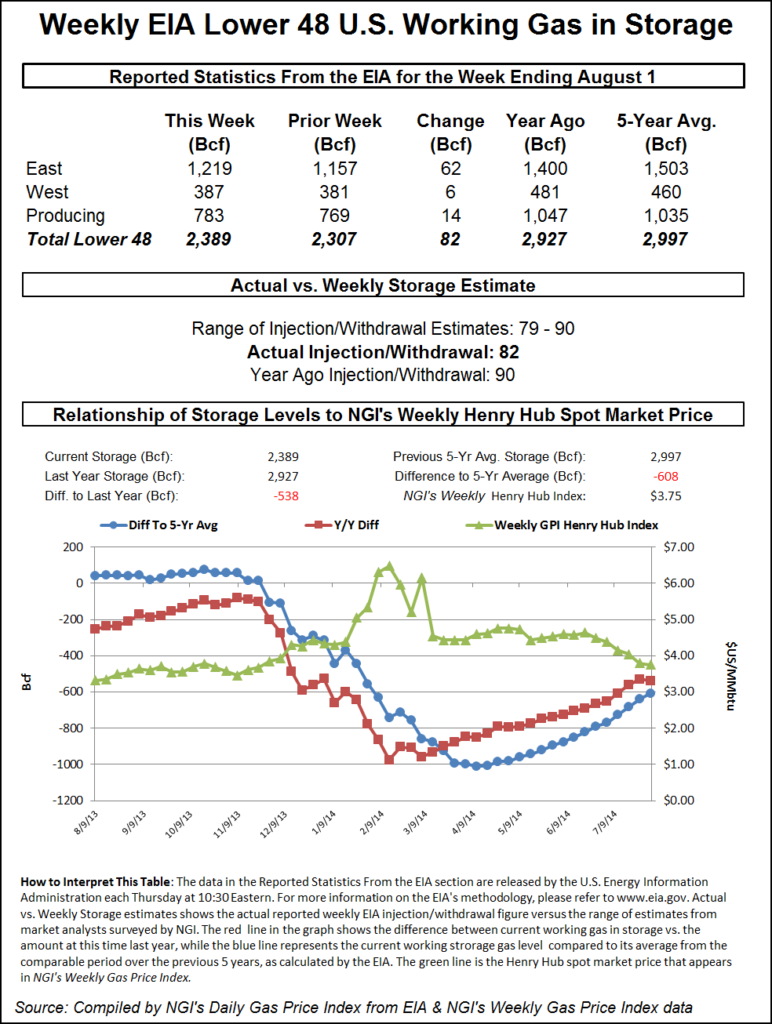
The Energy Information Administration (EIA) reported a build of 82 Bcf, slightly lower than consensus estimates, but the number was unable to prompt much in the way of market movement. At the close, September had fallen 5.7 cents to $3.876 and October was off 6.2 cents to $3.895. September crude oil added 42 cents to $97.34/bbl.
Prices at New England and Mid-Atlantic locations took it on the chin as temperature forecasts continued to struggle to register anything close to above normal, and load-killing showers and thunderstorms dominated the forecasts. Forecaster Wunderground.com predicted that Thursday’s high in Boston would rise to 81 degrees by Friday, but that is still 2 degrees shy of the seasonal norm. Saturday was expected to be 81 as well. Hartford, CT’s Thursday high of 84 was seen holding Friday before making it to 86 by Saturday. The normal early August high in Hartford is 83. Providence, RI’s 81 high on Thursday was predicted to inch up to 82 Friday and see 85 Saturday. The seasonal high in Providence is 83.
The National Weather Service in southeast Massachusetts said, “showers and thunderstorms will continue into this evening…some of which may be strong to severe with threats for hail and gusty winds. High pressure will dominate from this weekend into early next week, [and] low pressure may approach around the middle of next week.”
Quotes at the Algonquin Citygates for Friday deliveries shed 9 cents to $2.76, and gas into Iroquois Waddington was off 11 cents to $3.72. On Tennessee Zone 6 200 L next-day parcels were seen at $2.73, down 10 cents.
Mid-Atlantic and Marcellus next-day gas also softened. Gas bound for New York City on Transco Zone 6 fell 17 cents to $2.50, and packages for Tetco M-3 came in 14 cents lower at $2.43. Gas at Transco Leidy gained 3 cents to $2.20, and deliveries on Tennessee Zone 4 Marcellus fell 3 cents to $2.02.
Elsewhere in the East, next-day deliveries were also priced lower. On Millennium, Friday packages fell 16 cents to $2.26, and gas on Columbia TCO rose 7 cents to $3.94. Gas on Dominion South came in 12 cents lower at $2.28.
The low prices at points like Dominion, Millennium, and the Marcellus highlight the shifting economics of natural gas use for power generation.
“Energy prices in Appalachia are tilted towards gas over coal in both the spot and forward market for next summer. The massive surge in production around the Dominion South hub along with relatively weak summer demand has pushed the Dominion South spot price to $2.27/MMBtu,” said industry consultant Genscape in a report.
“August spot cash prices had averaged $3.30/MMBtu during the prior three years. Meanwhile, Central Appalachia [CAPP] coal is currently trading at $57.25/ton. Without accounting for coal transport or emissions costs, this equates to a coal cost of $2.29/MMBtu. While nearly at parity with gas, higher heat rates for coal plants makes gas more competitive. When assuming a coal plant heat rate of 10, CAPP coal cost $22.90/MWh. Gas comes in at $17/MWh when using a 7.5 heat rate.
“Similar trends are appearing in the forwards market for next summer. With CAPP coal for Summer 2015 trading at just over $60/ton, the cost to generate power from CAPP coal is $24/MWh versus $19/MWh for gas based on the current price of the Dominion summer strip at $2.55/MMBtu.”
Going into Thursday’s EIA storage report there appeared to be grist for both the bulls and bears. Estimates were swirling around the 84 Bcf level, and if compared to last year’s 90 Bcf injection could be interpreted as bullish. Yet the five-year average stands at 49 Bcf, and that would warrant a bearish conclusion. One thing to remember, though, is that last year’s 90 Bcf build included a 14 Bcf reclassification of base gas to working gas. With that in mind an 80-ish build could be seen as bearish on both counts.
IAF Advisors calculated a 79 Bcf increase, and United ICAP was expecting a build of 85 Bcf. A Reuters poll of 25 traders and analysts revealed an average 84 Bcf with a range of 79-90 Bcf.
Bentek Energy calculated a slim 80 Bcf injection based on a high cooling degree day (CDD) count in Texas and the Southeast with a partial offset in the East. “Power burn demand came in at the highest weekly average of the year at 27.9 Bcf/d, pushed higher by a 1.5 Bcf/d uptick in power demand within the Producing Region from the previous week. Total population-weighted cooling degree days within both the Southeast and Texas increased week-over-week by 11 and 21 degree days, respectively,” the firm said in a report.
“The strong cooling demand within the Producing Region and continued high demand levels within the West Region cut Bentek’s total sample injections with the regions by a combined 10 Bcf week-over-week, which was offset slightly by a small uptick in sample injections within the East Region by 3 Bcf. Total population-weighted CDDs within the East fell significantly week-over-week; however a drop in net flows into the region by nearly 0.5 Bcf/d helped keep storage injections similar to the previous week’s levels.”
The actual figure of 82 Bcf left some yawning. “The number didn’t affect any of the ranges at all. The market just rattled around,” said a New York floor trader. “Traders are looking for a reason to push the market higher, but is there any reason to do so? I don’t think so,” he said.
Tim Evans of Citi Futures Perspective saw the 82 Bcf figure as “helping to sustain what has been improving market sentiment. We note it is still well above the 50 Bcf five-year average, and so still bearish on a seasonally adjusted basis. That said, it does also indicate some modest tightening of the supply-demand balance relative to the weather for the period, which could also translate into lower injections in the weeks ahead. We still anticipate above average builds, but by a smaller margin.”
Inventories now stand at 2,927 Bcf and are 538 Bcf less than last year and 608 Bcf below the five-year average. In the East Region 62 Bcf was injected and the West Region saw inventories up by 6 Bcf. Inventories in the Producing Region rose by 14 Bcf.
Up until Thursday, the market’s recent firmness had technicians pondering whether the historical mid-August seasonal cycle low might be within reach. “Seasonal cycle low in place?” queried Brian LaRose of United ICAP following Wednesday’s trading. “If so, the risk from here is a rally of 107% into late November. The question at hand, where do the bears get in trouble?
“[We] see the first sign of trouble for the bears as a close above $3.998. However, to solidify the case for a bottom, the large cluster of resistance stretching from $4.267 to $4.442 must be exceeded. Bulls have some convincing to do.”
© 2024 Natural Gas Intelligence. All rights reserved.
ISSN © 1532-1231 | ISSN © 2577-9877 | ISSN © 1532-1266 |