Regulatory | NGI All News Access | NGI The Weekly Gas Market Report
FERC Says NatGas Nearly Half of New Power Generation in 2014
Natural gas accounted for nearly half of newly installed power generation capacity in 2014, and it currently represents the largest share of installed capacity, according to data from FERC.
In an Energy Infrastructure Update, compiled by the Federal Energy Regulatory Commission’s Office of Energy Projects, natural gas led all other fuel types in terms of cumulative new installed capacity — either new build or expansion — placed into service in 2014. The federal agency said a total of 490 power generation units, with a combined installed capacity of 15,384 MW, were placed into service in 2014. Of those, 59 were natural gas-fueled units totaling 7,485 MW. Biomass was a close second in terms of number of units with 58, but only representing 254 MW of capacity. Wind was third with 57 units (4,080 MW). Solar led in terms of the number of units installed (277), and was third overall in capacity (3,139 MW).
Other fuels of note were oil (15 units, 47 MW), water (10 units, 158 MW) and geothermal steam (five units, 32 MW).
By comparison, FERC said a total of 692 units, with a combined installed capacity of 15,886 MW, were placed into service in 2013. Natural gas also was tops that year in terms of installed capacity (94 units, 7,378 MW), and solar led in terms of units (364 units, 3,828 MW).
In 2014 there was a 29.2% decline in number of units installed compared to 2013, and 3.2% less new capacity installed. The number of natural gas units installed also was 37.2% less than in 2013, but despite that installed capacity rose 1.5%.
The FERC data shows natural gas represented 12% of the units installed in 2014, down from 13.6% in 2013. Natural gas also represented 48.7% of installed capacity in 2014, up from 46.4% in 2013.
Total installed operating generating capacity currently totals 1,168.76 GW. FERC said natural gas led all other fuel types with 492.97 GW, or 42.18% of total capacity. Coal was a distant second at 326.6 GW (27.94%). No other fuel was above 10% of total capacity; nuclear was closest at 106.87 GW (9.14%) followed by water at 98.39 GW (8.42%).
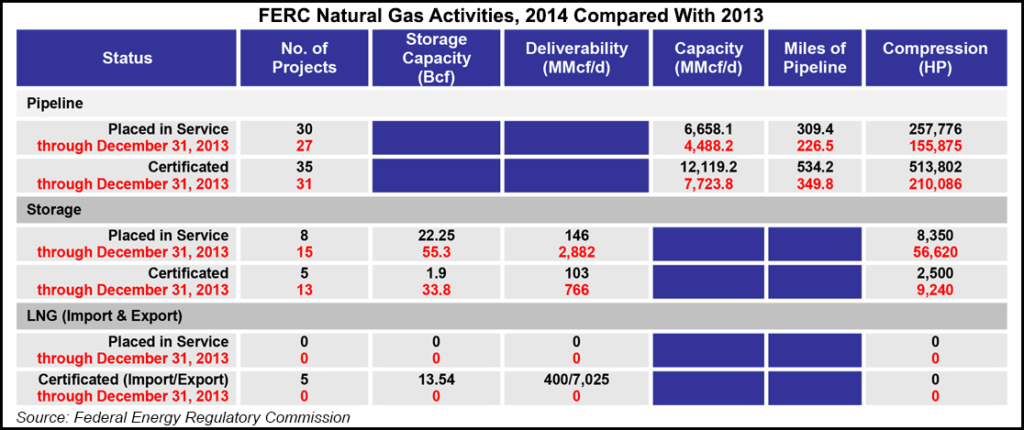
FERC also reported on natural gas activities for the full year 2013 and 2014.
According to federal regulators, there were 30 pipelines totaling 309.4 miles placed into service in 2014, which combined accounted for 6.66 Bcf/d of capacity and 257,776 hp of compression. There were 35 pipelines totaling 534.2 miles certificated in 2014, with 12.1 Bcf/d of capacity and 513,802 hp of compression.
By comparison, there were 27 pipelines totaling 226.5 miles placed into service in 2013, with 4.49 Bcf/d of capacity and 155,875 hp of compression. There were 31 certificated pipelines in 2013 totaling 349.8 miles, with 7.72 Bcf/d of capacity and 210,086 hp of compression.
FERC said there were eight storage projects placed into service in 2014, with 22.3 Bcf of storage capacity, 146 MMcf/d of deliverability and 8,350 hp of compression. Five storage projects — with 1.9 Bcf of storage capacity, 103 MMcf/d of deliverability and 2,500 hp of compression — were certificated in 2014.
By comparison, there were 15 storage projects placed into service in 2013, with 55.3 Bcf of storage capacity, 2.88 Bcf/d of deliverability and 56,620 hp of compression. Thirteen storage projects were certificated in 2013, totaling 33.8 Bcf of storage capacity, 766 MMcf/d of deliverability and 9,240 hp of compression.
FERC certificated five liquefied natural gas import and export projects in 2014. Combined, those projects account for 13.54 Bcf of storage capacity and 400 MMcf/d to 7.03 Bcf/d of deliverability.
For its reporting on new in-service generation and total installed operating generating capacity, FERC used data provided by Ventyx Global LLC, Velocity Suite and The C Three Group LLC. The agency used data compiled internally for its report on natural gas activities.
© 2024 Natural Gas Intelligence. All rights reserved.
ISSN © 1532-1231 | ISSN © 2577-9877 | ISSN © 1532-1266 |