NGI Data | NGI All News Access
End-Of-October Sees Across-The-Board Declines
For the three trading days ended Oct. 30 physical gas prices fell an average of 12 cents to $3.62, according to NGI‘s National Spot Gas Average.
Only a handful of points in the Northeast and Rocky Mountains registered gains, and all regions reported declines. The Northeast laid claim to both the greatest gains and greatest losses. Tennessee Zone 4 Marcellus rose 33 cents to $2.13, and Texas Eastern M-2 30 Delivery tumbled 24 cents to $3.53.
Regionally the Midwest and Midcontinent fell the most. The Midwest and Midcontinent both shed 15 cents to $3.79 and $3.62, respectively.
The Northeast was down 13 cents to $3.53 and South Louisiana lost 12 cents to average $3.55.
East Texas fell 10 cents to $3.56 while South Texas and the Rocky Mountains both lost 9 cents to $3.52 and $3.62, respectively.
California lost the least ground dropping 6 cents to $3.85.
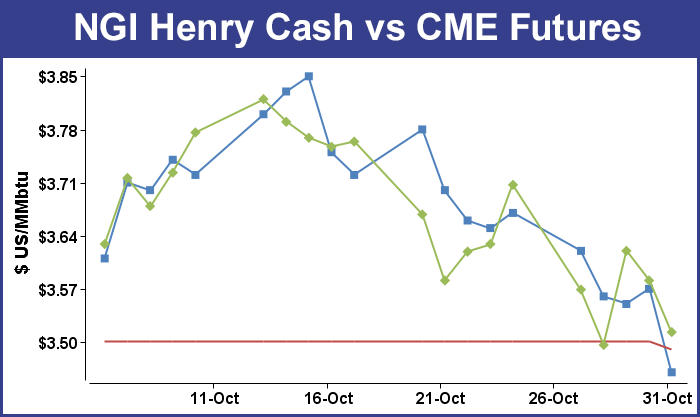
November futures expired Tuesday at $3.496, but that was later revised to $3.497 as the CME Group issued a very rare revision.
For the three trading days ended Wednesday, December futures gave up 19.2 cents to close at $3.620.
In Wednesday’s trading natural gas for delivery Thursday eased 2 cents overall on average. New England points lead the charge lower with double-digit losses, but Marcellus points gained ground. For the most part losers outnumbered winners but most locations managed to trade within a few cents of unchanged. At the close of trading December futures had fallen 0.9 cent to $3.620 and January was off by 0.3 cent to $3.711.
By the end of the week futures traders were lamenting the lack of cold weather. “I don’t think there is any cold weather in the country, and I look for the market to trade down to $3.35,” said a New York floor trader. “The trend is lower, and I think people are adding to short positions.”
Traders on Friday were also trying to make sense of a private notice sent by CME Group to clearing members, which explained that the trading exchange made a revision on Oct. 30 to the November 2013 natural gas futures contract expiration that occurred on Oct. 29.
Without providing a reason, CME Group in its notice revised the November contract’s expiration from $3.496 to $3.497.
“CME Clearing has contacted all affected firms and made the necessary adjustments,” the exchange said. Calls to CME for clarification were unreturned at time of press.
Settlement prices on the final day of trading for a contract are calculated as a weighted volume average during the last half hour, and queries to the exchange went unanswered. Some suggested “banging the close,” inputting large orders at the close to influence the settlement as a possible factor, or possible errors related to block trades — large Henry Hub trades made in an over-the-counter format but cleared by CME.
An industry veteran said much of the difficulty may be “how much work was done putting out invoices that someone had already made calculations on. It all depends on the amount of paperwork that was generated on the first price. Is it going to have to be redone based on this second price?”
The reason for the change is unclear, but “customers are complaining that there is a shift in value and that they have more paperwork,” said Tom Saal, vice president at INTL FC Stone in Miami.
On Thursday the Energy Information Administration (EIA) reported a build of 38 Bcf for the week ended Oct. 25, about 2 to 3 Bcf greater than market expectations, and futures eased.
According to top analysts, a more supportive weather outlook is going to be required for this market to establish a bottom, let alone any kind of advance. “We didn’t view [Thursday’s] EIA report as a game changer since it wasn’t far removed from our expectation,” said Jim Ritterbusch of Ritterbusch and Associates. “And while the surplus against average levels narrowed to only 58 Bcf, such an overage appears ample to meet upcoming winter needs with production cruising along at a record pace.
“Until the short-term temperature views shift in the direction of some below-normal trends, this market will continue to have difficulty placing a price bottom. [Thursday’s] close below our expected $3.60 support level would appear to favor additional selling that could carry to the pre-expiration November lows of $3.48. While closing the November-December gap would be a counter-seasonal development, current bearish supply-side forces combined with mild temperature views into mid-November can easily provide ingredients for an additional 10-cent decline from [Thursday’s] settlement.”
Ongoing production increases are likely to keep the bulls corralled. The EIA reported Thursday that Lower 48 natural gas production for August reached a record 74.82 Bcf/d, up 0.3%. Stout declines were seen in the offshore Gulf of Mexico and Louisiana, but the “Other States” category including the Marcellus region surged 2.4% to 27.02 Bcf/d.
Weather forecasters see a series of fickle cool and warm patterns with no clear trend. Commodity Weather Group in its six- to 10-day and 11- to 15- day outlooks sees “a speedy pattern situation continu[ing] with transient warm and cool periods affecting the Midwest, East and South over the next two weeks. Most of the changes [Friday] were tweaks to make the warmer events a bit warmer and the cooler events a bit cooler, but the national demand picture is close to unchanged if not slightly lower demand.
“This continues to be a tricky pattern as it cannot be cleanly called a cold or warm-prevailing one. In the 11-15 day, there are still hints of a Midcontinent cold push edging forward to around day 13, but the European ensembles wash out the impacts by days 14-15…,” said Matt Rogers, president of the firm
Traders Thursday were eager to get deals done ahead of weekly government inventory statistics. East and Northeast locations were down by solid double digits. Gains at Marcellus points along with firm quotes at SoCal Border and Gulf locations were unable to offset the broader selling.
The 10:30 a.m.EDT storage report was somewhat above market expectations. Traders were expecting a build in the 34 to 36 Bcf range, and the actual figure of 38 Bcf sent prices scooting to the low of the day. “$3.60 was initial [technical] support and now I’m thinking $3.56 is the new support zone. If the number would have come in a lot higher, we would have seen more action,” said a New York floor trader.
“The gain was less than the date-adjusted 65 Bcf build from last year and the 57-Bcf five-year average, but a below average injection should have already been discounted into the price,” said Tim Evans of Citi Futures Perspective. “Since the outcome wasn’t surprising, the report may have simply removed the risk of a surprise from the market for another week, freeing up trade flow.”
Inventories now stand at 3,779 Bcf and are 120 Bcf less than last year’s record-setting build and 58 Bcf above the 5-year average. In the East Region 17 Bcf was injected and in the West Region 3 Bcf was added. Inventories in the Producing Region increased by 18 Bcf.
© 2024 Natural Gas Intelligence. All rights reserved.
ISSN © 2577-9877 | ISSN © 1532-1258 |