Marcellus | Bakken Shale | E&P | Eagle Ford Shale | Haynesville Shale | NGI All News Access | NGI The Weekly Gas Market Report | Permian Basin
EIA: Most Shales Primed For Higher Production in 2014
Production from five of the top six major tight/shale oil and natural gas regions in the United States are projected to increase over the next year, reaching totals comparable to nations on the world stage, according to data from the U.S. Energy Information Administration (EIA).
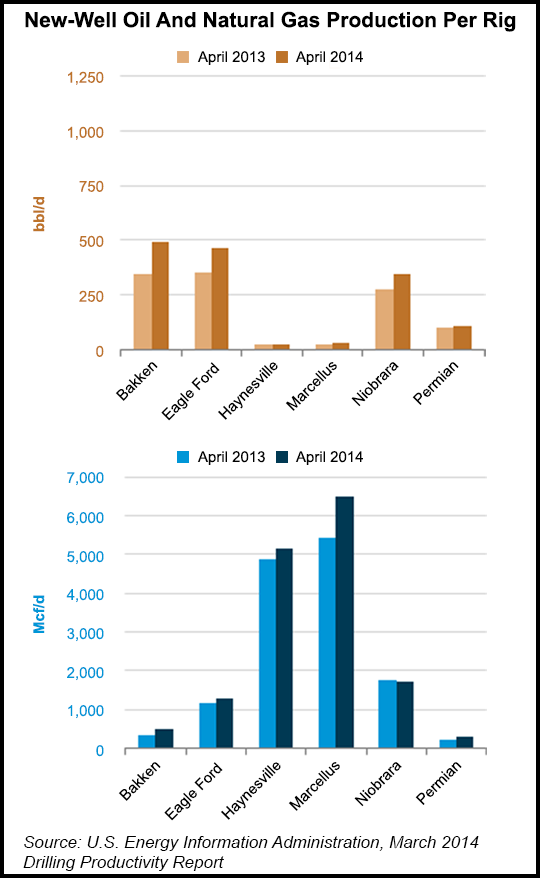
In a 10-page drilling productivity report released Monday, the EIA analyzed production from six tight/shale regions: the Bakken, Eagle Ford, Haynesville and Marcellus shales, the Niobrara formation and the Permian Basin.
The EIA reported that monthly natural gas production for an average rig deployed in the Marcellus is projected to increase by 74 Mcf/d between March and April, climbing from 6,402 Mcf/d to 6,476 Mcf/d. An average rig targeting the Haynesville over the same time frame is expected to see an increase of 25 Mcf/d (from 5,142 Mcf/d to 5,167 Mcf/d).
As for the oil plays, rigs in the Bakken from March to April are expected to see gas increases of 9 Mcf/d (488 Mcf/d to 497 Mcf/d); Eagle Ford rigs would have an estimated monthly gain of 8 Mcf/d (1,272 Mcf/d to 1,280 Mcf/d); with Permian increases averaging 5 Mcf/d (269 Mcf/d to 274 Mcf/d).
The only formation projected to see a loss in monthly gas production is the Niobrara, which is expected to lose 10 Mcf/d this month, falling from 1,723 Mcf/d to 1,713 Mcf/d.
In terms of year-over-year (y/y) production, EIA data projects the Marcellus will see the biggest increase, 37.8%, rising from 10.7 Bcf/d in April 2013 to 14.8 Bcf/d in April 2014. The Bakken and Eagle Ford are expected to see the next highest increases in y/y production, with the Bakken climbing 30.2% (from 887.9 MMcf/d to 1.16 Bcf/d) and the Eagle Ford up 29.8% (5.06 Bcf/d to 6.57 Bcf/d) during the same time frame.
EIA said the Permian is forecast to see a small increase of 10.7% in y/y production in April, from 4.85 Bcf/d in 2013 to 5.37 Bcf/d. Meanwhile, the Niobrara would remain essentially unchanged, from 4.53 Bcf/d to 4.57 Bcf/d. Only the Haynesville is projected to see a loss in y/y production, falling 21.9% from 8.18 Bcf/d to 6.39 Bcf/d in April 2014.
According to the EIA’s international energy statistics for 2012, the most recent year that figures are available, the United States led all other nations in terms of natural gas production, averaging 80.9 Bcf/d. Russia followed at 63.2 Bcf/d, followed by Iran (22.4 Bcf/d), Algeria (17.7), Canada (17.3), Qatar (15.7), Norway (15.5), Saudi Arabia (11) and China (10.4).
© 2024 Natural Gas Intelligence. All rights reserved.
ISSN © 2577-9877 | ISSN © 1532-1266 | ISSN © 2158-8023 |