NGI Weekly Gas Price Index | Markets | NGI All News Access
Demand Losses Hit Weekly Natural Gas Prices; Further Declines Expected as Winter Draws to a Close
The fallout of the Covid-19 pandemic kicked up a notch during the March 30-April 3 period as stay-at-home measures were extended across the country, slaughtering what little demand remained following an unusually mild winter and sending weekly gas prices lower.
However, with some preventative initiatives to slow the spread of the coronavirus just beginning in some cities, losses were fairly small at the majority of pricing locations across the Lower 48. NGI’s Spot Gas Weekly Avg. fell just 4.5 cents to $1.360.
California posted the largest gas price declines for the week as stormy winter weather finally cleared and left behind warm, sunny skies that sapped demand. SoCal Citygate prices plunged 39.0 cents week/week to average $1.465, while PG&E Citygate fell a much more modest 7.5 cents to $2.230.
Farther upstream in the Permian Basin, Waha dropped 9.5 cents on the week but managed to average in positive territory at 12.5 cents. Similar losses were seen throughout the rest of the Lone Star State, while prices in Louisiana came off a bit more week to week. Henry Hub fell 11.0 cents week/week to average $1.555.
Weekly prices barely budged in the country’s midsection, while most markets on the East Coast churned out small gains. Transco Zone 6 NY was up 4.0 cents to $1.410.
Demand destruction took center stage in Nymex futures trading as the calendar flipped to April. Prices tumbled for the March 30-April 3 week as the Energy Information Administration (EIA) provided the first glimpse into the toll the Covid-19 has taken on gas demand.
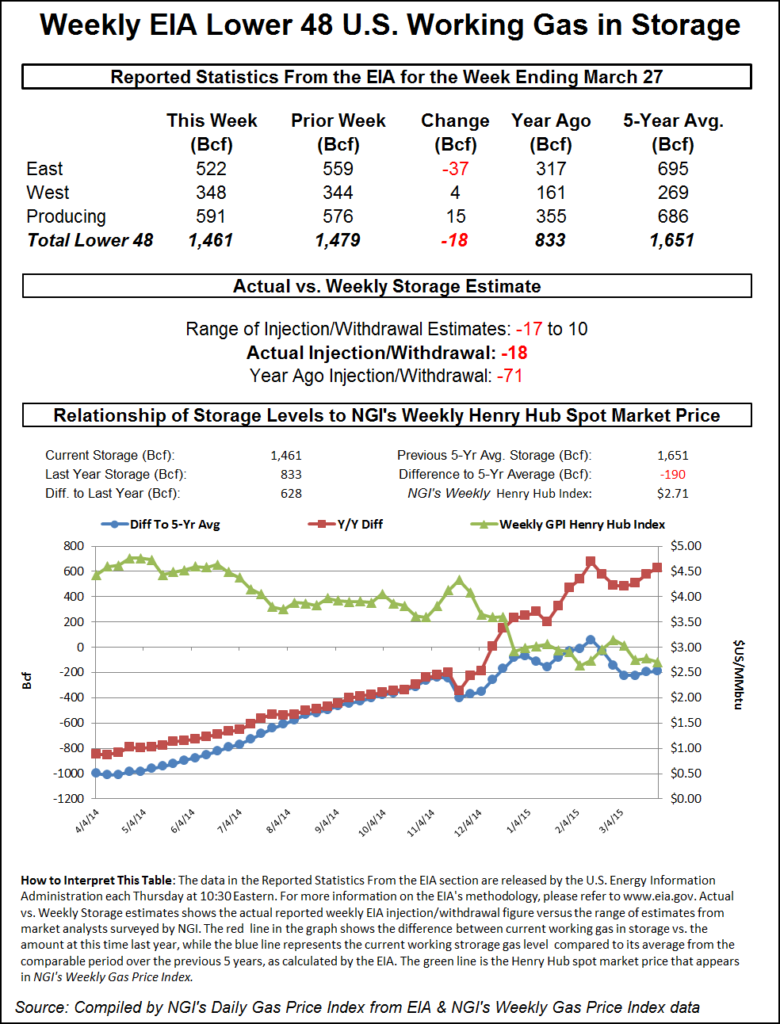
The May contract hit an intraweek high of $1.731 during Tuesday’s session, but prices quickly deteriorated from there. The prompt month fell as low as $1.521 low Thursday after the EIA reported that Lower 48 storage inventories fell by 19 Bcf for the week ending March 27, a much smaller draw than what had been expected by the market.
Considering total degree days were roughly flat week/week, a linear extrapolation would be that Covid-19 effects loosened balances by 1.5 Bcf/d for the reporting period, according to Mobius Risk Group. “However, temperatures were cooler in the South, and this could easily account for most of the change versus the prior week.”
Broken down by region, the East and Midwest each withdrew 16 Bcf out of inventories, while the South Central posted a net 11 Bcf injection, EIA said. This included a surprising 14 Bcf build in nonsalt facilities, and a 2 Bcf draw from salts.
Total working gas in storage as of March 27 was 1,986 Bcf, 863 Bcf above year-ago levels and 292 Bcf above the five-year average of 1,694 Bcf, according to EIA.
Genscape Inc. also pointed out the relatively stable degree-day levels but noted major changes in its supply and demand models during the last two EIA reporting periods. Net supply (production plus net exports) fell by 11 Bcf, while demand declined by 17 Bcf, data showed.
“While there could be some makeup” from the prior week’s report, which was 4 Bcf larger than Genscape’s estimate, the firm “clearly saw a large week/week decline in gas demand that was unrelated to weather.
“Total power generation across the Lower 48 fell by 3% week/week, while Lower 48 total degree days were essentially flat,” Genscape senior natural gas analyst Rick Margolin said.
Futures caught a bid on Friday, trading a few cents higher for most of the day as weather models trended even chiller for the next couple of weeks but then catapulting even higher into the close. The May contract went on to settle Friday at $1.621, while June capped the week at $1.738.
As cash prices sink further below $1.50, the spread between the spot market and nearby futures contract should incentivize aggressive salt storage builds, according to Mobius. “Whether or not this occurs over the weekend will have a direct correlation to the Globex market open on Sunday night.”
Interestingly, while power burns have fallen, there haven’t been similar impacts to industrial demand for gas, at least not yet, Goldman Sachs Commodities Research noted. The firm said that recent industrial consumption numbers remain in line with year-ago levels and with the expectations it held prior to its recent demand downgrade, that is, approximately 2.5 Bcf/d above our revised April expected levels.
“Net, despite the last storage data point for March coming out (Thursday) softer than consensus, the month of April is starting tighter than expected as resilient industrial demand for gas, exceptionally high LNG feed gas and Lower 48 production slightly below our 93 Bcf/d expectation for the month more than compensate for the observed declines in power burns,” Goldman Sachs analysts said.
Going forward, they expect U.S. gas balances to soften in the coming weeks as the economic slowdown weighs more visibly on domestic manufacturing and a sustained shutting of the U.S. liquefied natural gas export arb incentivizes reactions further from off-takers. Last month, top U.S. exporter Cheniere Energy Inc. reportedly purchased six cargoes for delivery to Europe this summer.
Cash posted another day in the red amid a mostly mild set-up forecast for the Lower 48 through the next several days. Most regions posted modest declines in trading for gas delivered through Monday.
NatGasWeather said the southern states were expected to be “very nice” into the first full week of April, with highs of 70s and 80s making for “very light demand.” There’s a “decent” cold shot forecast over the Rockies and Plains, but the firm noted the cooler weather would hit lower population states. The Midwest and Northeast, meanwhile, were expected to warm well above normal beginning late in the weekend, keeping demand at bay in those regions.
Even with widespread stay-at-home measures, losses in the cash market were fairly small in most areas of the United States. Interestingly, prices were hit harder in the Rockies, where some of the chilliest weather was expected in the coming days.
Kingsgate prices for gas delivered through Monday fell 12.0 cents day/day to average $1.310. Northwest Wyoming Pool tumbled 20.0 cents to $1.195.
In California, Malin spot gas dropped a solid 10.5 cents to $1.335, while farther upstream in the Permian Basin, Waha slipped only 1.5 cents to average 5.0 cents.
Some East Texas points posted small increases day/day, as did a handful of pricing hubs in Louisiana. However, Henry Hub prices for gas delivered over the three-day period fell 3.5 cents to $1.445.
On the East Coast, the majority of markets softened a bit day/day, but some posted much larger declines from ongoing pipeline maintenance. PNGTS spot gas was down 30.5 cents to $1.885, but the typically far more volatile Algonquin Citygate was down 1.5 cents to $1.395.
On the pipeline front, Tennessee Gas Pipeline (TGP) notified shippers on Thursday of an emergent repair on its Regency Dunkleberger gathering system meter in Tioga County, PA, that requires the meter to shut in for 16 hours on Monday (April 6).
This meter has nominated as much as 109 MMcf/d in the last month, but production has trended downwards, nominating 76 MMcf/d for Friday’s gas day, according to Genscape.
“It is unlikely that production will fully shut in on Monday,” Genscape natural gas analyst Josh Garcia said.
Then, beginning Tuesday through June 8, TGP is to conduct anomaly remediation from “MLV 114-2 to MLV 110-2,” on Segment 114 in Northeast Kentucky. This outage will lower its operational capacity from 923 MMcf/d to 760 MMcf/d for the rest of the week before a larger restriction takes place from April 13-29 that would lower operational capacity on this segment to 680 MMcf/d, according to Garcia.
“TGP’s outage impact report states that primary impact restrictions may be necessary for these events, the highest risk of impact on the report,” the analyst said.
Reported flows from Station 111 to Station 114 have maxed at 929 MMcf/d over the last two weeks and averaged 812 MMcf/d, meaning up to 249 MMcf/d of flows may be impacted.
“Export capacity on this production zone will be constrained, incentivizing lower TGP Z3 prices as producers will compete to export their gas,” Garcia said.
Meanwhile, New York is weeks away from retiring the 1,028 MW Indian Point Nuclear Plant’s Unit 2. The scheduled April 30 retirement follows that of the 675 MW Somerset Plant, the New York Independent System Operator’s last coal generator, which retired on March 31.
Indian Point has not contributed consistent generation in the last few years, and several recent gas builds throughout the Northeast started contributing more generation in light of the retirements, according to Genscape. These include the 1,100 MW Cricket Valley Plant on the Iroquois Pipeline, the 680 MW CPV Valley Plant on Millennium Pipeline and the 350 MW Canal Unit 3 on Algonquin Gas Transmission.
Older, less efficient gas generators no longer contribute as much baseload generation as they used to, but still are capable of assisting with peak demand if needed, Garcia said. Meanwhile, renewable capacity additions such as wind, utility scale and behind-the-meter solar, and batteries continue to grow amid a state push for 50% renewables in the electricity mix by 2030 and 100% renewables by 2040.
© 2024 Natural Gas Intelligence. All rights reserved.
ISSN © 2577-9877 | ISSN © 1532-1258 |