Markets | NGI All News Access | NGI Data
Demand Forecasts Launch NatGas Cash; April Futures Gain 8 Cents
Both physical and financial natural gas for next-day delivery got a shot in the arm Thursday as forecasts of increasing energy demand into the weekend boosted spot prices up and down the Eastern Seaboard and futures posted strong gains following a supportive Energy Information Administration (EIA) inventory report.
In the physical market outside the Northeast, California and the Rockies robust double-digit gains prevailed. California and the Rockies were generally confined to single-digit gains, but in the Northeast multi-dollar increases were common. The NGI National Spot Gas Average jumped 23 cents to $2.89.
The storage withdrawal of 68 Bcf was well below the five-year norm, but reality versus expectations is what matters and even with an adjustment the report was enough above what traders were looking for. Bulls seized the day and at the close April had added 7.3 cents to $2.974. and May was up 6.5 cents to $3.046. April crude oil continued to languish dropping $1.00 to $49.28.
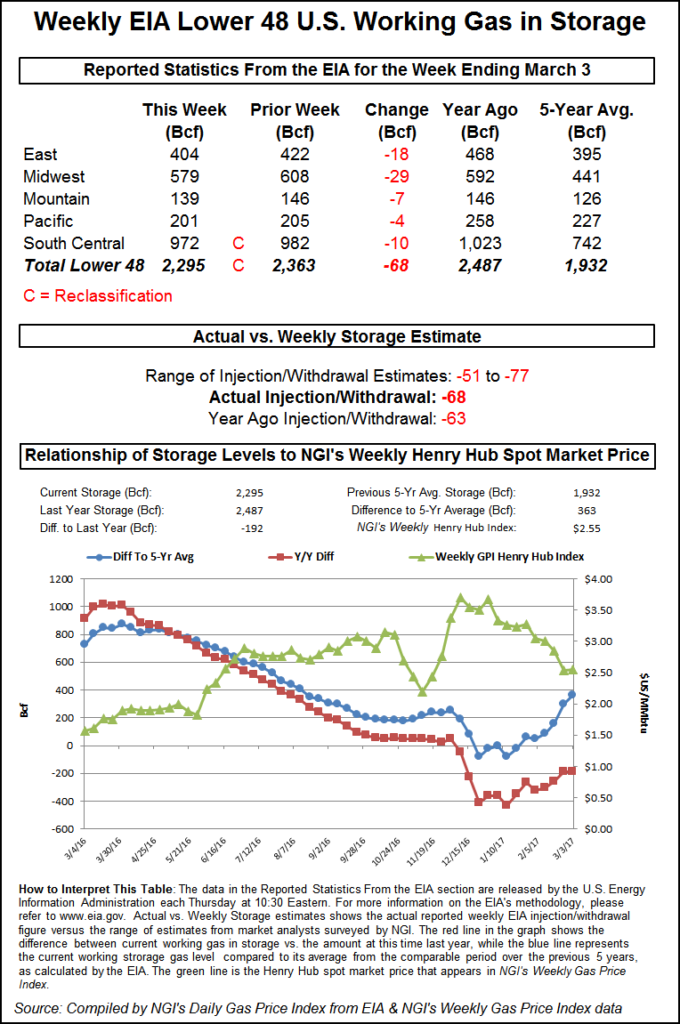
EIA reported a 68 Bcf storage withdrawal for the week ending March 3 in its 10:30 a.m. EST release, but 4 Bcf of that represented a reclassification of working gas to base case, thus making the actual flow 4 Bcf less. The implied flow, however, of 64 Bcf was still about 3 Bcf greater than industry estimates. March futures rose to $2.976, and by 10:45 a.m. March was trading at $2.949, up 4.8 cents from Wednesday’s settlement.
Prior to the report, Ritterbusch and Associates was looking for a 54 Bcf withdrawal. A Reuters survey of 18 traders and analysts showed an average 61 Bcf pull with a range of -51 Bcf to -77 Bcf. Last year 63 Bcf was withdrawn and the five-year pace is for a 136 Bcf pull.
“It looks like the market has the potential to test the $3.01 level, and the possibility to ‘pop the top’ [$3.01] is there,” said a New York floor trader. “If it does that, I have a feeling it will be a bull trap. If it breaks back over $2.95, I think it tests the $3.01 area.”
“The 64 Bcf ‘implied flow’ figure was slightly more than the expected draw for last week, but the combined 68 Bcf reduction in total storage looks like somewhat more of a bullish surprise,” said Tim Evans of Citi Futures Perspective. “While much more supportive than last week’s 7 Bcf build, this report was still bearish compared with the five-year average 132 Bcf draw for the date.”
BMO Capital Markets Analyst Randy Ollenberger also saw the storage withdrawal as somewhat bullish.
“We believe the storage report will be viewed as slightly positive,” he said. “Storage is trending below last year’s levels, and we believe that U.S. working gas in storage could trend toward five-year lows by the end of the 2017 summer injection season, assuming normal weather.”
In spite of the draw being well below the five-year average, others also see a positive tone to the market as long as weather behaves itself.
“The EIA reported a storage draw of 68 Bcf, leaving storage about 360 Bcf (about 19%) above average, and providing a shift back towards normal a week after the first ever February injection,” said Jefferies analyst Zach Parham in a note to clients. “Last week, we reduced our 2017 natural gas price forecast to $3.15/MMBtu (from $3.50/MMBtu) as warm weather in January/February pushed storage levels above average. We remain bullish longer term ($3.50/MMBtu 2018-plus forecast) on tighter supply/demand balances (excluding weather).”
Inventories now stand at 2,295 Bcf and are 192 Bcf less than last year and 363 Bcf greater than the five-year average. In the East Region 18 Bcf was withdrawn, and the Midwest Region saw inventories decrease by 29 Bcf. Stocks in the Mountain Region fell 7 Bcf, and the Pacific Region was down 4 Bcf. The South Central Region dropped 10 Bcf.
Energy demand from New England to New York and across the PJM footprint was forecast to increase even into the relatively energy-quiet weekend, and prices surged. ISO New England forecast that Thursday’s peak load of 15,600 MW would climb to 16,100 MW Friday and reach 16,700 MW by Saturday. PJM Interconnection predicted that Thursday’s maximum load of 31,346 MW would reach 35,512 MW Friday and 35,785 MW Saturday. New York ISO forecast that peak load of 18,735 MW Thursday would advance to 19,347 MW Friday and 19,364 MW Saturday.
Prices pounced. Next-day gas at the Algonquin Citygate jumped $2.96 to $5.94, and deliveries to Iroquois Waddington gained 93 cents to $3.99. Gas on Tenn Zone 6 200L vaulted $2.49 to $5.56.
In the Mid-Atlantic, gas on Texas Eastern M-3, Delivery rose 35 cents to $2.84, and deliveries to New York City via Transco Zone 6 gained 64 cents to $3.14.
Surging next-day power prices also made the purchase of incremental gas supplies for power generation a no-brainer. Intercontinental Exchange reported on-peak Friday power at ISO New England’s Massachusetts Hub jumped $15.00 to $41.60MWh, and at New York ISO’s Zone G terminal (eastern New York) peak Friday power gained $10.75 to $34.00/MWh. Next-day power at the PJM West terminal rose a healthy $5.63 to $33.24/MWh.
[Subscriber Notice Regarding NGI’s Market-Leading Natural Gas Price Indexes]
Overnight weather models continued the recent trend towards cooler patterns. MDA Weather Services in its morning six- to 10-day outlook said, “Forecast trends were once again in the colder direction and focused in the eastern half. This comes with an increase in confidence with the positioning of a coastal low at the onset of the period and stronger model trends for high pressure that is left in its wake.
“On average, the period sees much below normal temperatures from the Mid-Atlantic to the Northeast while below-normal readings span westward into the Midwest as well. The Midwest is coldest early on, but aboves return to that region late. Warmer forecast changes are seen in the West, and the Southwest/Rockies favor much aboves throughout the period.”
© 2024 Natural Gas Intelligence. All rights reserved.
ISSN © 1532-1231 | ISSN © 2577-9877 |