NGI The Weekly Gas Market Report | Markets | NGI All News Access
BP Leads The Way as Natural Gas Marketers Bounce Back 7% in 2Q2016
BP plc and a host of other perennial natural gas marketing powerhouses reported impressive numbers for the second quarter, according to NGI’s 2Q2016 Top North American Gas Marketers Ranking, nearly erasing the previous quarter’s declines in the first upturn in sales in more than two years.
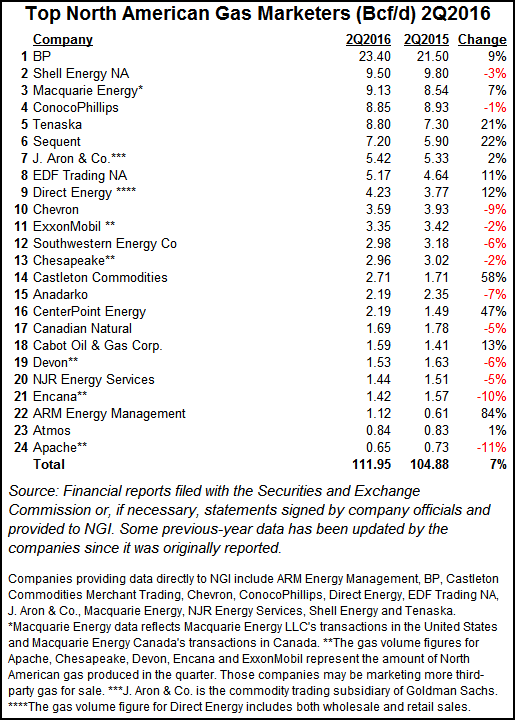
The snapshot of two dozen leading gas marketers reported combined sales transactions of 111.95 Bcf/d in 2Q2016, a 7% increase compared with 2Q2015. Seven of the NGI survey’s Top 10 marketers, and half of the companies overall, reported increases compared with 104.88 Bcf/d in 2Q2015. In 1Q2016, those same gas marketers had reported combined sales transactions of 116.44 Bcf/d, a 7% decline compared with 1Q2015.
The NGI survey ranks marketers on sales transactions only. FERC in its Form 552 tallies both purchases and sales. Natural gas trading volumes soared 9.4% higher last year compared with 2014, likely because of continued increased production, the retirement of coal-fired electricity generators, and a probable increase in consumption because of lower prices, according to a recent analysis by Natural Gas Intelligence (NGI) of 2015 Form 552 filings with the Federal Energy Regulatory Commission (see Daily GPI, June 9, 2016).
“FERC 552 data showed a strong increase in marketed volumes in 2015, and I think a major reason for that is that prices were so much lower overall in 2015,” said Patrick Rau, NGI director of strategy and research. “Those lower prices led to an increase in gas consumption, everything else being equal. My guess is that marketed volumes continued to benefit from lower prices through the first two quarters of 2016, and that is likely being reflected in 2Q16 marketed volumes.”
However, Rau believes the recent increase in gas prices could weigh on marketed volumes for the second half of 2016, especially if natural gas becomes less competitive versus coal.
“Of course, higher prices should lead to an increase in production, but that will not necessarily happen en masse before the end of the year. Several key producers are in the process of adding rigs and drawing down DUCs [drilled but uncompleted wells], but that’s more with an eye toward 2017 than it is for taking advantage of the immediate spot market strength.
“Since late May, U.S. producers have added 90 oil focused rigs, while gas oriented drilling has continued to decline, going from 87 in late May to 81 last week. So 2H16 marketed gas volumes could see a double-whammy from lower industrial and power generation demand and declining production.”
Maryland-based energy consultant Ben Schlesinger sees the hand of globalization altering traditional methods of analyzing natural gas markets.
“The paradigm has shifted and price forecasting isn’t what it used to be,” Schlesinger told NGI. “Now you’ve got to be responding to world markets. The old paradigm of ‘if we understand what’s going on in North America, we can assess it and forecast a price’ — I’m not comfortable that that’s going to be here much longer.
“I’m not sure that’s bad news for us. It may be good news…global markets are more aggressive than normal markets, and we may be seeing the influence of that. And the additional volumes coming through Sabine Pass may be having an affect on price. We all understood many years ago during the debate about liquefied natural gas [LNG] exports — which debate is over, we’re going to be exporting a lot — but at the time the debate was on, we really said this was not going to affect the price of gas very much. I still believe that, but compared to what? Compared to a forecast of what it would take to rebalance North American markets, the with/without LNG scenario wasn’t that much different, and that makes sense. But when we’ve seen prices at the $1 to $2 range, they’re out of balance…that’s bound to go up with or without exports.”
Perennial No 1. BP led the 2Q2016 marketers charge with 23.40 Bcf/d, a 9% increase compared with 21.50 Bcf/d in 2Q2015. The London-based supermajor recently reported second quarter profit was off sharply from a year ago, but it increased sequentially as BP continued to tout “drawing a line under” Macondo well blowout costs, as well as the success of cost-cutting efforts company-wide (see Daily GPI, July 26).
Shell Energy NA reported 9.50 Bcf/d in 2Q2016, a 3% decline compared with 9.80 Bcf/d in 2Q2015. Like BP, Shell’ second quarter profits plunged from a year ago (see Daily GPI, July 28). Last month, Royal Dutch Shell plc agreed to take $425 million from EnVen Energy Corp. for the Brutus platform and Glider production system in the deepwater Gulf of Mexico (see Daily GPI, Aug. 29).
Macquarie Energy reported 9.13 Bcf/d sales in 2Q2016, a 7% increase compared with 8.54 Bcf/d in the same period in 2015. ConocoPhillips, which has been plagued by significant declines since it implemented business model restructuring in North America following the spin-off of downstream operations four years ago (see Daily GPI, April 17, 2012), reported 8.85 Bcf/d, just a 1% decline compared with 8.93 Bcf/d in 2Q2015. In2Q2012, on the eve of the restructuring, ConocoPhillips reported 16.27 Bcf/d.
At No. 5 in the survey, Tenaska reported 8.80 Bcf/d in 2Q2016, a 21% leap from 7.30 Bcf/d in 2Q2015. Other Top 10 companies reporting increases were Sequent (7.20 Bcfd, up 22% from 5.90 Bcf/d), J. Aron & Co. (5.42 Bcf/d, up 2% from 5.33 Bcf/d), EDF Trading NA (5.17 Bcf/d, up 11% from 4.64 Bcf/d) and Direct Energy (4.23 Bcf/d, up 12% from 3.77 Bcf/d).
Other highlights of the survey include a 58% increase for Castleton Commodities (2.71 Bcf/d, compared with 1.71 Bcf/d in 2Q2015), a 47% increase for CenterPoint Energy (2.19 Bcf/d, compared with 1.49 Bcf/d in 2Q2015), a 13% increase for Cabot Oil & Gas Corp. (1.59 Bcf/d, compared with 1.41 Bcf/d in 2Q2015), and an 84% increase for ARM Energy Management (1.12 Bcf/d, compared with 0.61 Bcf/d in 2Q2015).
© 2024 Natural Gas Intelligence. All rights reserved.
ISSN © 1532-1231 | ISSN © 2577-9877 | ISSN © 1532-1266 |