NGI Archives | NGI All News Access | NGI The Weekly Gas Market Report
Raymond James Again Raises Land Rig Forecast on Growth in Horizontals
The pace of U.S. drilling activity, particularly horizontal drilling, has exceeded an already optimistic forecast by Raymond James & Associates, which on Monday again revised upward its expectations for the domestic 2015 land rig count by 5%. The horizontal rig count for 2015 now is expected to average 11% higher year/year (y/y) — well above an original forecast of 6%.
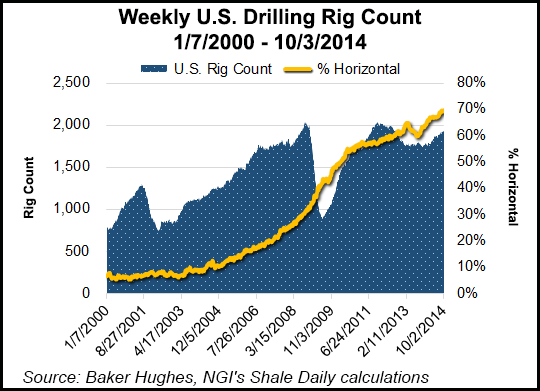
Even though oil prices have been falling over the past few months, U.S. land drilling activity has continued to rise significantly, with the Baker Hughes Inc. domestic rig count up 11% year-to-date, or about 190 rigs over the same time in 2013, noted analysts J. Marshall Adkins, James M. Rollyson and Praveen Narra. The trio dissected the numbers in a weekly Energy Stat. The “best” U.S. oilfield spending metric, which they consider to be the horizontal rig count, now is about 24% higher than in 2013, or nearly 260 rigs more than at this time a year ago.
Raymond James analysts had revised upward their domestic rig count higher only four months ago (see Shale Daily, June 2). However, the pace of activity is stronger than ever, particularly in the unstoppable Permian Basin (see related story).
“Accordingly, we are raising our average 2015 U.S. rig count estimate by 5%, or about 100 rigs (from 1,862 rigs to 1,965 rigs),” wrote Adkins and his colleagues. “More important, we are also raising our 2015 average horizontal rig y/y growth rate forecast from 6.1% y/y growth to 11.0% y/y growth. Given that most of our expected growth is in the horizontal area, our new 2015 y/y total U.S. rig forecast is flat versus our previous forecast that was up 1.1% y/y.”
The Permian alone has accounted for more than half (54%) of the total U.S. rig count growth year-to-date and 52% of the horizontal growth, analysts noted. Next year those numbers should move even higher. In addition, conversations with operators indicate plans to add rigs across many basins in 2015
The increase in horizontal activity is going to be driven by expansion not only in the Permian, “the lead dog,” which will continue to be the “biggest piece of the pie,” but also in the Eagle Ford and Bakken shales, as well as the Powder River Basin (PRB), where Chesapeake Energy Corp. alone plans to add nine rigs in 2015. As well, the Cana-Woodford Shale, “the second-highest contributor” of horizontal drilling year-to-date, has accounted for 9.3% of this year’s horizontal growth and it should continue to grow. Also contributing are other Midcontinent plays like the South Central Oklahoma Oil Province, or SCOOP.
The Raymond James team is modeling a “slow bleed” in the total rig count for the Eagle Ford for 2015, reflecting an increase in the oil rig count, but offset by a decrease in the number of natural gas rigs. For the Bakken, moderate growth is expected through next year. The PRB should account for 3% of the total rig increase in 2015.
“As far as U.S. upstream spending in 2015 goes, oil prices are no longer the only driver of that bus” because “continued efficiencies from pad drilling, hydraulic fracturing and increased stages per well continue to increase recoveries and lower costs per unit of oil and gas produced,” said analysts.
Cash flow growth for U.S. exploration and production (E&P) companies has improved steadily because oil and gas volumes have increased more than spending — on drilling efficiencies.
“Since costs have risen more slowly than production and energy prices, E&P operating costs per unit of production has improved since 2011,” wrote Adkins and his team. “The corollary is that this has led to a substantial improvement in E&P capital efficiency and profitability. We expect this trend to continue over the next few years. That means even in a flat or backwardated commodity environment, E&P cash flows can still improve.”
© 2024 Natural Gas Intelligence. All rights reserved.
ISSN © 2577-9877 | ISSN © 1532-1266 | ISSN © 2158-8023 |