NGI Data | NGI All News Access
Weekly Traders Hit Hard With Futures, Physical Price Volatility
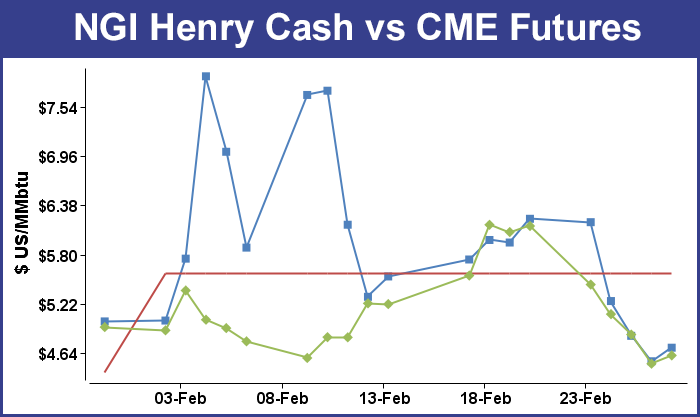
It was a week of gut-wrenching price changes for both futures and physical natural gas traders. The March futures contract expired Wednesday at a “reasonable” $4.855, but just two days prior, it had traded as high as $6.493 before falling into a tailspin and losing 69.0 cents on the day and finishing at $5.445 Monday. Tuesday’s and Wednesday’s trading added cumulative losses of another 59.0 cents — a 21% drop over three days — and any March futures bulls left standing limped off into the cold and snow to shore up margin accounts.
The physical market had its own issues of volatility to deal with as well. The NGI Weekly Spot Gas Average added $1.53 to $9.33, but regional variations around that figure were wide enough to drive a propane truck through. Much of the differences between regions were the result of another Polar Vortex which ripped through the Great Lakes and Upper Midwest and headed east. Regions less in the way of the brutal cold experienced losses on the week of a half dollar or more, but the Midcontinent, Midwest, and Northeast all experienced multi-dollar gains.
The individual points with the week’s greatest gains were the Algonquin Citygates with a rise of $13.73 to average $29.66 but normally thinly traded Dracut was right behind with a rise of $12.69 to $28.90.
On the losing end Tennessee Zone 5 200 L tumbled $1.98 to average $10.12, and Texas Eastern E LA followed with a loss of 91 cents to $5.02.
Regionally South Louisiana fell 83 cents to $5.09, South Texas shed 79 cents to $4.97, and East Texas came in at a decline of 69 cents to $5.05.
California was off by 36 cents to $5.88 and the Rocky Mountains posted a loss of 32 cents to average $5.68.
The big winners on the week were the Midcontinent, the Midwest, and the Northeast. The Northeast mustered a gain of $2.96 to $10.55, and the Midcontinent rose by $2.97 to $12.02. Not only did the Midwest enjoy the week’s greatest regional gain at $8.17, but it also registered the highest average overall price of $22.79, more than $10 higher than the next region.
March futures settled Wednesday at $4.855, down $1.28 from Friday’s settlement or a loss of 21% in just three trading sessions.
The now spot April natural gas futures rose Friday to $4.609, up 9.8 cents on the day.
Those futures traders still standing following the March expiration were attempting to explain the three-day freefall (see Daily GPI, Feb. 25), and were optimistic that with the volatile March contract off the board, April was ready to stabilize. “I think we will get some bottoming in the April contract,” said a New York floor trader. “The 10- to 14-day weather forecast is a little milder, but I still think April is a ‘buy’ at $4.50 and we will head back to $4.80 to $4.85 over the next couple of days.”
Traders also saw the recent wild gyrations in the March contract as divorced from market fundamentals. “With the temperature outlook still pointing to colder than normal temperatures in the eastern U.S. through the 11-15 day forecast period, it is hard to see how the underlying fundamental picture ties in with the price action so we are inclined to attribute it to an imbalance in the March trade flows than any material change in the physical market,” said Tim Evans of Citi Futures Perspective. “The steadier performance of the April futures supports this hypothesis to some degree.”
Others agreed that the free-falling March futures had “little to do with market fundamentals,” said Teri Viswanath, BNP Paribas director of commodity strategy. “Absent a back-stop in physical buying, financial profit-taking continues to pressure the front of the U.S. natural gas curve lower.
She said the market has witnessed a record depletion in storage, with the North American pipeline network likely to continue to encounter problems delivering gas next month.
“However, unlike 2003 when the late season rally was sustained [through] the expiry, spot purchases remain somewhat anemic so far this week as a result of current mild conditions,” Viswanath added.
The dominant futures price driver Thursday was the Energy Information Administration report of a gas storage withdrawal of 95 Bcf. Although the initial reaction by the futures market was muted, prices went on to finish the day lower. Volatility was considerably lower than prior sessions. Traders were looking for a pull above 100 Bcf, but shortly after the number was released, the April contract was just a few ticks off Wednesday’s settlement.
“People were looking for a number between 103 to 107 Bcf, and we were looking for the market to come off, but it did not follow through. It came off a few cents and then recovered,” said a New York floor trader. He said the April contract was enjoying support at $4.40 and resistance at $4.60.
Analysts at Energy Metro Desk (EMD) were waxing nostalgic on natural gas storage. “Once upon a time, a 100 Bcf pull around this time of the year was considered fairly big. No mas. We’ve seen so many 225+ Bcf draws this year we’ve lost track,” said John Sodergreen, the editor. “In the past four weeks we’ve pulled nearly a Tcf out of storage (980 Bcf), or roughly 245 Bcf per week; last year, same period, we pulled just over 600 Bcf. The five-year average for the past four weeks is 608 Bcf. The Polar Vortex is in for a return engagement in the next couple days. Next week’s report should only show a pull in the 120-150 neighborhood, but the following week analysts tell us another 200+ Bcf pull is in the cards.”
EMD was looking for a pull of 103 Bcf in Thursday’s storage report, as was United ICAP. Bentek Energy’s flow model calculated a 93 Bcf withdrawal, and a Reuters poll of 23 traders and analysts revealed an average 107 Bcf with a range of 96 Bcf to 128 Bcf. Last year, 165 Bcf was pulled and the five-year pace stands at 125 Bcf.
Even with February in the rearview mirror, weather forecasters are warning that you might not want to break out the Bermuda shorts yet.
“March may not come in like a lion everywhere across the nation, but winter will roar during the first several days of the month and impact more than 100 million people,” said AccuWeather.com meteorologist Alex Sosnowski. “Early indications are that a long-duration snow event will expand from the northern Rockies and central Plains to portions of the Midwest and Northeast in the days ahead. The adverse winter conditions will develop Friday into Saturday over the Plains and are forecast to shift slowly eastward Sunday and Monday. Snowfall from the west-to-east storm will exceed a 1,500-mile stretch on its journey. Several storms will slice eastward in the snow area this weekend with the main storm forecast to roll out Sunday to Monday.”
WeatherBELL Analytics saw ongoing, if not brutal, cold continuing along with elevated heating requirements. In its Thursday morning 20-day forecast it predicted nationally a six- to 10-day period accumulation of 154.3 heating degree days (HDD), well above last year’s 118.6 HDD and much greater than the 30-year average of 104.8 HDD. In the 11- to 15-day time frame, HDDs are seen at 109.5, greater than last year’s 92.9 and also greater than the 30-year average of 92.8 HDD.
Meteorologist Joe Bastardi sees incredible cold coming, certainly by late winter standards, and looks for “a spectacularly cold opening week to March, with major winter storms from the Plains to East.” He says week two should show some moderation but nowhere near mild. “CFSv2 [NOAA Climate Forecast System version 2] keeps teleconnections favorable for cold all month and has coldest March from the Plains to the East since 1996.
“The GFS [Global Forecast System] operational at 00z and 06z is forecasting unheard of, historic cold in the East in the wake of the major snow/ice event that is coming. No way can it be argued that these runs are warm. The only “warm” is in relation to the super cold that is opening the month. The model, over the eastern Ohio Valley into the Northeast, has not only the coldest so late in the season in some places a week from today, but the coldest ever! This is simply unbelievable (so I don’t believe it for the big cities, but it’s one of those things where you look and marvel at how a model can see such a thing).
“We have seen the ECMWF [European] do this and here is what I have found. The temperatures don’t show up in the HEART of the big cities, but if one goes to the mesonets [networks of automated weather stations], one finds the cold in areas around the cities. So even if we moderate this by 20 degrees F let’s say, for this time of the year, it’s still 25 degrees F below normal. A -27 degrees F in Johnstown, PA, is over 40 degrees F below normal.”
© 2024 Natural Gas Intelligence. All rights reserved.
ISSN © 2577-9877 | ISSN © 1532-1258 |