NGI Archives | NGI All News Access
Shale Gale Blowing Harder, EIA Says
The shale gale, first in natural gas and then in oil, has blown through the energy sector and is filling the sails of U.S. industrial consumers and power generators while it creates headwinds to energy imports.
The U.S. Energy Information Administration (EIA) released the early version of its Annual Energy Outlook 2014 (AEO2014) on Monday. Since the previous outlook the United States is projected to become even more of an energy “have” as opposed to “have-not.”
Cumulative production of dry natural gas from 2012 to 2040 in the AEO2014 reference case is about 11% higher than in AEO2013, primarily reflecting continued growth in shale gas production resulting from the dual application of horizontal drilling and hydraulic fracturing, EIA said. Another contributing factor is ongoing drilling in shale and other plays with high concentrations of natural gas liquids and crude oil, which in energy-equivalent terms have a higher value than dry natural gas.
“Cumulative production levels for tight gas and onshore associated-dissolved gas from oil formations exceed those in AEO2013 through 2040 by 9% and 36%, respectively, making material contributions to the overall increase in production,” AEO2014 said. “Natural gas prices above $6/MMBtu toward the end of the projection period encourage drilling in less-productive but still-profitable areas in tight oil, shale oil, and natural gas formations.
“Lower 48 offshore natural gas production fluctuates between 1.7 Tcf and 2.9 Tcf per year, similar to the pattern in AEO2013. The multi-year decline in offshore natural gas production was reversed in 2012, with 15 new deepwater projects coming online during the year.”
Production of crude oil (including lease condensate) in the AEO2014 reference case increases from 6.5 million b/d in 2012 to 9.6 million b/d in 2019, 22% higher than in AEO2013. Despite a decline after 2019, U.S. crude oil production remains at or above about 7.5 million b/d through 2040. Higher production volumes result mainly from increased onshore oil production, predominantly from tight formations.
The faster growth of tight oil production through 2020 in the AEO2014 reference case results in higher domestic crude oil production than in AEO2013 throughout the projection. “The pace of oil-directed drilling in the near term is much stronger than in AEO2013 as producers locate and target the sweet spots of plays currently under development and find additional tight formations that can be developed with the latest technologies,” EIA said.
In the AEO2014 reference case, tight oil production increases from 2.3 million b/d in 2012 (35% of total U.S. crude oil production) to 4.8 million b/d in 2021 (51% of the total). As in AEO2013, tight oil production declines in AEO2014 after 2021, as more development moves into less-productive areas.
“The EIA report confirms that the United States really is experiencing an energy revolution. Once again, a combination of price, technology and new areas has pushed away fears of shortage. And it’s not over. Technologies will continue to advance capabilities and widen opportunities,” according to IHS Vice Chairman Daniel Yergin, who wrote The Quest: Energy, Security, and the Remaking of the Modern World.
“This is not only about energy, but also is proving a big boost to the U.S. economy at a time when it really needs a boost. This also underlines even more the question of when and how this revolution goes global. Around the world — from China to the Middle East to Europe to Mexico — this surge from the United States has become a top focus of energy discussion and also a new factor in geopolitics.”
Abundant supply and low prices will drive consumption of gas in the industrial and electric power sectors to new levels in 2040 as exports of U.S. gas via pipeline and in liquefied form grow as well, according to the outlook.
A higher level of industrial shipments will lead to more natural gas consumption (including lease and plant fuel) in the U.S. industrial sector, increasing from 8.7 quadrillion Btu in 2012 to 10.6 quadrillion Btu in 2025 in AEO2014, compared to 9.8 quadrillion Btu in 2025 in AEO2013.
According to EIA, industrial shipments grow at a 3.0% annual rate over the first 10 years of the projection and then slow to 1.6% annual growth for the rest of the projection, EIA said. Bulk chemicals and metals-based durables account for much of the increased growth in AEO2014. Industrial shipments of bulk chemicals, which benefit from an increased supply of natural gas liquids, grow by 3.4% per year from 2012 to 2025 in AEO2014, as compared with 1.9% in the AEO2013 reference case. The projection assumes growing competition from abroad that flattens output growth in energy-intensive industries after 2030.
At home in the United States, natural gas will overtake coal in market share for power generation, EIA said. “In 2040, natural gas accounts for 35% of total electricity generation, while coal accounts for 32%,” AEO2014 said. “Generation from renewable fuels, unlike coal and nuclear power, is higher in the AEO2014 reference case than in AEO2013.”
Along with domestic consumption of gas, exports also will grow over the period, according to the outlook’s reference case. U.S. exports of liquefied natural gas (LNG) increase to 3.5 Tcf in 2029 and remain at that level through 2040. Pipeline exports of U.S. gas to Mexico grow by 6% per year, from 0.6 Tcf in 2012 to 3.1 Tcf in 2040, and pipeline exports to Canada grow by 1.2% per year, from 1.0 Tcf in 2012 to 1.4 Tcf in 2040.
Over the same period, U.S. pipeline imports of gas from Canada fall by 30%, from 3.0 Tcf in 2012 to 2.1 Tcf in 2040, as more U.S. demand is met by domestic production, EIA said.
The supply growth of domestic crude oil and gas will drive down the country’s reliance on energy imports over the period.
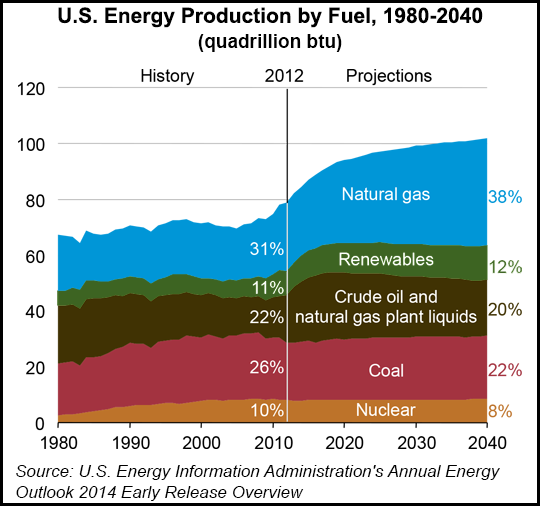
In the AEO2014 reference case, U.S. domestic energy production increases from 79.1 quadrillion Btu in 2012 to 102.1 quadrillion Btu in 2040, and net use of imported energy sources, which was 30% in 2005, falls from 16% of total consumption in 2012 to 4% in 2040. In the AEO2013 reference case, domestic energy production reached a total of 98.5 quadrillion Btu, and energy imports are projected to decline as a percentage of consumption to 9% in 2040.
The larger increase in domestic energy production in the latest outlook is primarily a result of higher projections of production of natural gas and biomass/other renewables. Crude oil production (including lease condensate) increases from 13.9 quadrillion Btu in 2012 to a peak of 20.5 quadrillion Btu in 2019 before dropping to 16.0 quadrillion Btu in 2040.
With domestic crude oil production rising to 9.5 million b/d in 2016, the import share of U.S. petroleum and other liquids supply falls to about 25%. Domestic production begins to decline after 2019, and the import share of total petroleum and other liquids supply grows to 32% in 2040, still lower than the 2040 level of 37% in the AEO2013 reference case.
Meanwhile, increased use of natural gas in power plants — along with residential and transportation sector efficiency gains — will contribute to U.S. energy-related carbon dioxide (CO2) emissions staying below their 2005 level through 2040, according to EIA.
© 2024 Natural Gas Intelligence. All rights reserved.
ISSN © 2577-9877 | ISSN © 2158-8023 |